Author: admin

  • Ecuador Oil Boom (1972–1981): Growth and the State

    Ecuador Oil Boom (1972–1981): Growth and the State

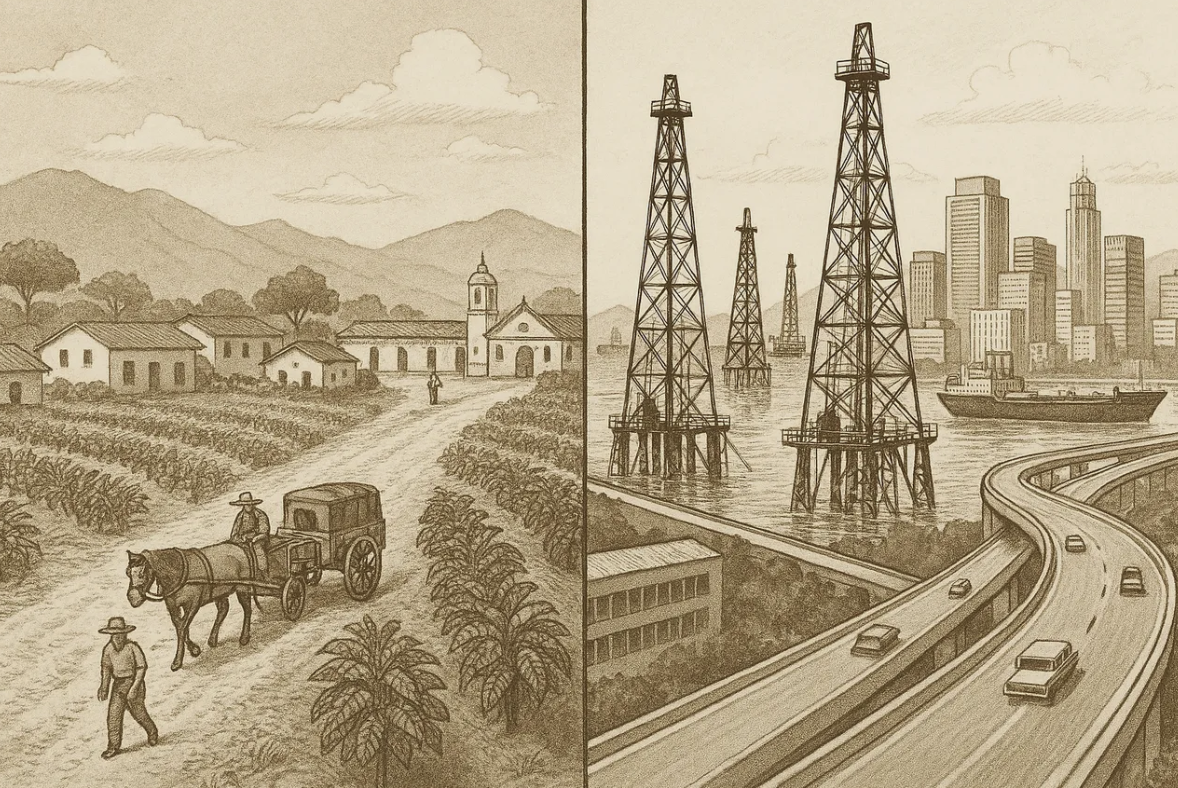
    In August 1972, oil began flowing through a newly completed pipeline across the Andes, and Ecuador’s economy changed almost overnight. Between 1972 and 1981, the country experienced one of the fastest growth episodes in its modern history, driven by the sudden start of large-scale oil exports. Real GDP grew at close to 9 percent per year, while exports and government revenues expanded sharply within a few years. The same period also locked in a larger state, higher public spending, and rising external debt that proved difficult to reverse.

    The transformation began in August 1972 with the completion of the Trans‑Andean oil pipeline linking Amazon oil fields to the Pacific coast. Oil rapidly accounted for more than half of total exports, bringing total exports to roughly a quarter of GDP. Central government expenditure doubled as a share of GDP, while public foreign debt increased almost eighteenfold by 1981. Manufacturing output also grew rapidly in the mid-1970s, as oil revenues allowed the state to scale up import-substitution policies already in place.

    The central policy implication is that Ecuador’s oil boom reshaped the entire economic and institutional ecosystem, not just the export sector. The sections that follow examine how capital stocks, institutions, and social structures changed during the period. They then explain how these changes unfolded through variation, selection, and diffusion. Finally, they assess how state action directed, financed, and adapted to the transformation.

    Oil Rents: Capital, Institutions, Society

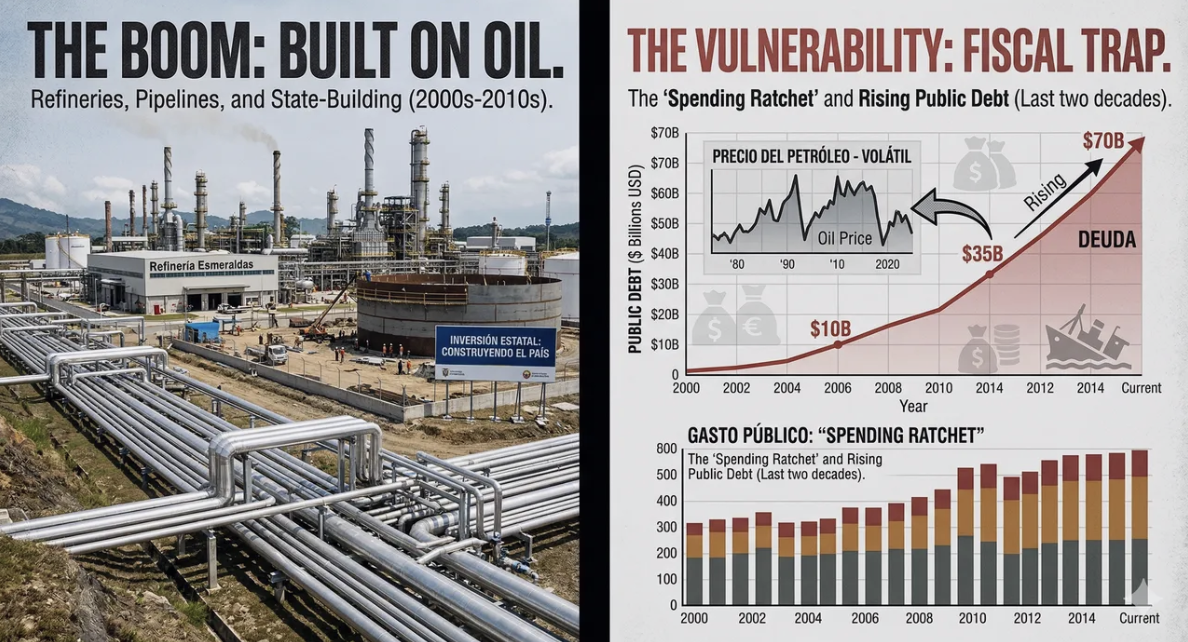
    The oil boom fundamentally altered Ecuador’s capital stocks by rapidly expanding physical and financial assets tied to extraction and public investment. The 503‑kilometer Trans‑Andean pipeline, completed in 1972, enabled commercial oil production at scale for the first time. Oil revenues financed large public investments, with capital expenditure averaging about 17 percent of government spending and directed mainly to highways, hydroelectric plants, and state enterprises. Financial capital also surged as oil accounted for roughly one‑third of central government revenues and generated large foreign‑exchange inflows in the early years. At the same time, external sovereign borrowing replaced foreign direct investment as the main external capital flow, pushing public foreign debt from US$248 million in 1971 to more than US$4 billion by 1981. Natural capital was drawn down rapidly through oil extraction in the Amazon, while environmental costs were not reflected in fiscal or investment decisions during the period.

    Institutional change accompanied the rapid accumulation of oil‑based capital. The 1971 Hydrocarbons Law declared hydrocarbons to be inalienable property of the state and laid the legal foundation for state control of the sector. In 1972, the government established the state oil company, CEPE. It progressively increased its ownership stake in the main oil consortium, reaching 62.5 percent by 1977 after buying out Gulf Oil. Planning and coordination functions were strengthened through JUNAPLA, Ecuador’s national planning body, which allocated oil revenues to infrastructure and industrial projects. The Industrial Promotion Law structured import‑substitution incentives, offering duty exemptions on capital goods and protection from imports for favored industries. These institutions expanded the state’s role in directing investment decisions across the economy.

    The oil‑driven expansion reshaped Ecuador’s social and economic structure. Urbanization accelerated as public investment in roads, electricity, and water created construction and service jobs, drawing labor from rural areas. Agriculture’s share of GDP and employment declined, while construction, services, and manufacturing expanded. Public sector employment grew rapidly as ministries and state enterprises expanded payrolls, broadening urban wage employment. Distributional effects were uneven: urban wage earners benefited from rising public and industrial employment, while rural incomes lagged, and agrarian reform redistributed only a small share of cultivable land. Inflation averaged around 13 percent per year, eroding fixed incomes and placing greater pressure on poorer households.

    New Activities, Policy Selection, Lasting Effects

    The period introduced economic activities and organizational forms that had little precedent in Ecuador. Large‑scale oil extraction in the Amazon and pipeline transport across the Andes represented an entirely new production system. The creation of CEPE marked a shift from concession‑based oil development to a state‑led, joint-operations model. Import-substitution manufacturing expanded under tariff protection and capital goods subsidies, encouraging the establishment of new factories producing consumer goods and intermediate inputs. Ecuador’s accession to OPEC in 1973 integrated the country into a global oil governance regime that influenced pricing and production norms. Together, these changes increased the diversity of economic activities, though many relied heavily on state support.

    Selection mechanisms during the boom were driven primarily by policy and external shocks rather than market competition. The Hydrocarbons Law and subsequent decrees forced most foreign oil companies to relinquish concessions, leaving CEPE and its remaining partner as the dominant producers. The 1973 global oil price shock sharply increased oil export rents, reinforcing state control and dependence on petroleum revenues. Industrial policy sheltered manufacturing firms from competition, selecting activities based on access to incentives rather than efficiency or employment generation. Political events also mattered: disagreements within the military government over the pace of nationalization and fiscal expansion contributed to the 1976 leadership change, after which the expansionary model continued but with some moderation. These filters favored capital‑intensive, protected sectors while weakening traditional agriculture.

    Many features of the oil‑era transformation persisted beyond the boom years. Central government expenditure remained at roughly double its pre-1972 share of GDP even after oil prices fell, indicating strong downward rigidity. CEPE’s dominant role in oil production was consolidated through successive equity acquisitions, institutionalizing state control of the sector. Import‑substitution policies and planning institutions remained in place through the late 1970s, even as fiscal pressures mounted. By contrast, there is little evidence that systematic learning led to major course corrections during the boom, such as saving oil revenues or restructuring incentives. The diffusion of oil‑financed infrastructure and public employment created lasting expectations about the state’s role in development.

    State Policy: Investment, Regulation, Debt

    The state played a decisive role in directing the transformation through laws, regulations, and strategic choices. The Hydrocarbons Law of 1971 redefined ownership rights and enabled the state to retroactively restructure contracts. Subsequent decrees enforced territorial relinquishment by foreign companies and empowered CEPE to operate across the oil value chain. Trade, investment, and labor regulations were used to support import substitution, limit foreign ownership in selected sectors, and manage wages and working conditions. Ecuador’s participation in OPEC further embedded state involvement in determining export conditions. These measures provided a clear signal that oil rents would be centrally managed and deployed to support development objectives.

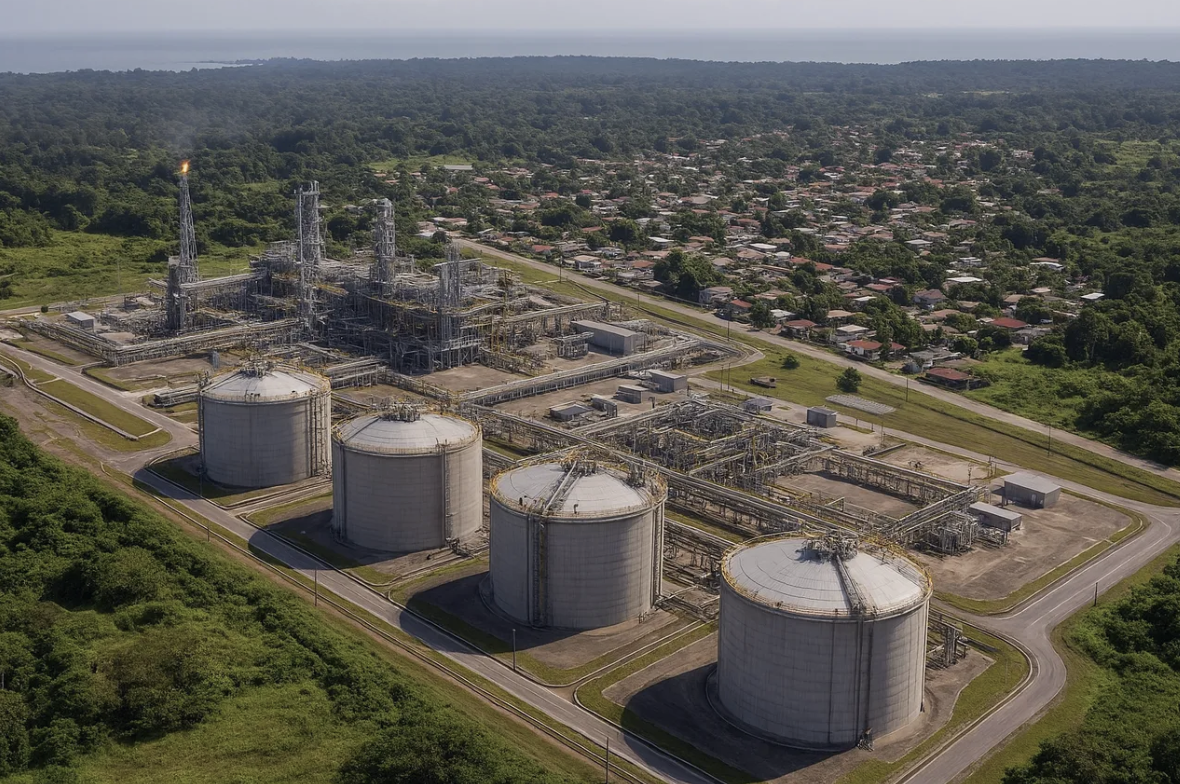
    Oil revenues allowed the state to become the economy’s principal investor and coordinator. Public capital spending expanded rapidly, financing highways, hydroelectric plants, refineries, and urban infrastructure that reshaped production and settlement patterns. The Esmeraldas refinery, which began operations in 1978, exemplified state‑directed industrial investment linked to oil extraction. Credit allocation through public banks and development funds supported favored sectors, while fuel subsidies and public employment sustained urban consumption. When revenues proved insufficient to match spending ambitions, the government relied on abundant international liquidity to borrow externally at low interest rates. This strategy mobilized resources quickly but increased vulnerability to future shocks.

    Evidence of adaptive policy management during the boom is limited. Despite rising inflation, growing imports, and mounting debt in the late 1970s, fiscal expansion largely continued. Some adjustments occurred, including currency devaluations and price increases toward the end of the decade, but these did not reverse the underlying spending trajectory. The absence of a stabilization or savings mechanism meant that oil windfalls were fully spent rather than smoothed over time. Institutional learning within CEPE and the industrial promotion system appears to have been slow, with operational inexperience and incentive misalignment persisting. As a result, the state entered the early 1980s with a larger public sector, heavy debt burdens, and limited buffers.

    Lessons for LAC Policymakers

    Ecuador’s 1972–1981 oil boom delivered rapid growth while transforming institutions and social structures. Oil exports and prices generated unprecedented revenues that financed infrastructure, industrial expansion, and a larger state. These gains were accompanied by rising debt, inflation, and uneven distributional outcomes. Many institutional changes proved durable even after the boom ended.

    The experience illustrates a development path in which resource rents accelerate accumulation but also entrench rigidities. A larger public sector, centralized control over strategic resources, and protected industries became defining features of the economy. Infrastructure and urbanization gains endured, while diversification and human capital development lagged. The legacy was an economy more complex than before 1972, but also more exposed to fiscal and external shocks.

    Over the longer run, the boom left Ecuador with a state-growth model structurally tied to oil rents. The infrastructure and expanded public administration created real capacity, but they also raised the economy’s break-even fiscal needs and hardened expectations around subsidies and public employment. When oil prices fell or external financing tightened, adjustment pressures surfaced through debt stress, stop‑go public investment, and renewed conflict over how to distribute and govern the rent. In this sense, the boom’s central legacy was not only faster growth in the 1970s, but a durable pattern of procyclical policy and volatility anchored in petroleum wealth, reinforced by oil-rent institutions built under military rule in the 1970s.

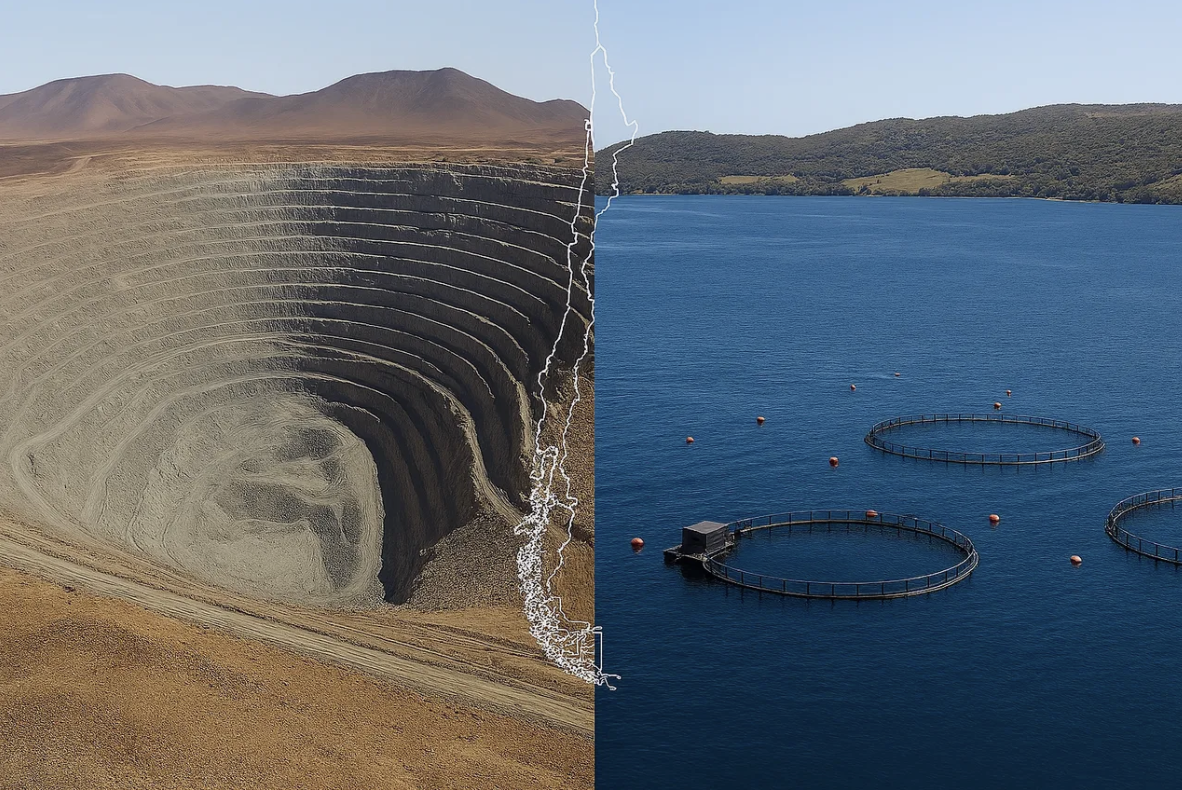
    For LAC governments managing resource windfalls today—whether from oil, gas, copper, or lithium—Ecuador’s record offers three specific warnings grounded in the evidence. First, the design of industrial incentives matters more than their scale: Ecuador’s Industrial Promotion Law channelled capital into protected factories that generated few jobs and depended permanently on state support, because the law rewarded capital intensity rather than employment or productivity. Getting incentive design right at the outset is far harder to fix once firms and lobbies have organised around the existing structure. Second, fiscal expansion during a boom is a one-way ratchet: central government spending doubled as a share of GDP. It never reversed, because the political cost of cutting it proved insurmountable once expectations were set. Stabilization funds must be established at the start of the windfall, not its end. Third, ownership transfer must be sequenced with capacity building: CEPE was handed majority control of Ecuador’s oil sector before it had the technical experience to run it, slowing exploration and operational efficiency for years. Venezuela faced the same challenge in the same decade with PDVSA. The lesson is not to avoid state ownership but to invest in institutional competence before, not after, transferring control.

  • How Costa Rica Made EVs Scale

    How Costa Rica Made EVs Scale

    In 2015, Costa Rica registered fewer than 500 electric vehicles. By 2024, EVs accounted for more than 1 in 10 new registrations—powered almost entirely by renewable electricity. The country did this without oil money, without a massive industrial base, and across two major political transitions. That is the puzzle this blog tries to explain—and to translate for policymakers elsewhere in the region.

    Costa Rica shifted toward high-value manufacturing and knowledge-based services after 2015. Services accounted for most output and export earnings, and export earnings concentrated in sophisticated segments. Real GDP growth averaged about 3.5% before 2020, contracted sharply when the pandemic hit, then rebounded strongly in 2021 and remained solid through 2023–2024. The free trade zone (FTZ) platform and foreign direct investment (FDI) in life sciences and corporate services anchored export performance and modern-sector jobs.

    The core argument is simple: Costa Rica’s transformation since 2015 did not come from a single policy or sector. Three enabling systems reinforced each other—an export platform anchored in FTZ-led sophistication, a renewable electricity base that enables low-carbon electrification, and a state able to digitize high-volume services. The lesson for policymakers elsewhere in Latin America is not to copy a flagship reform, but to focus on sequencing and reinforcement: what changes when these systems are built in parallel rather than in isolation.

    The sections that follow show how the systems compounded: first, shifts in capital stocks, institutions, and economic structure; second, how variation, selection, and diffusion turned pilots into routines; and third, how laws, market rules, coordination, and adaptive management helped reforms persist across political cycles.

    What is transferable—and what is not

    Costa Rica is a structural outlier in Latin America: it is small (roughly 5 million people), has maintained an overwhelmingly renewable power mix, lacks a hydrocarbon sector, and, since 2021, has been anchored by OECD accession standards. The point is not that other countries can replicate these conditions, but that many can adapt the mechanisms that turned them into durable change. Read the case by separating transferable policy design from context-dependent enablers:

    Broadly transferable lessons (mechanisms): stabilize incentives with a clear glidepath (e.g., extend EV incentives to 2034 with phased adjustments rather than abrupt reversals); run charging rollout as a service network with spacing and reliability targets; start digital transformation with one or two high-volume services (such as digital health) before pushing interoperability across government; and coordinate an export platform (investment promotion, skills, and supplier development) so tradable upgrading can finance and legitimize longer-horizon transitions.

    Context-dependent lessons (starting conditions): a near-zero-carbon power system makes transport electrification immediately low-emissions; countries with fossil-heavy grids may need to pair EV rollout with a credible power-sector decarbonization and reliability plan. OECD accession provided an external governance anchor (a credible external commitment that raises the cost of backsliding on institutional reforms); where that is unavailable, governments can mimic the effect through domestic fiscal rules, independent regulators, performance compacts, and peer-review partnerships. Costa Rica’s small geography and concentrated corridors simplified charging rollout; larger countries may need phased corridors (freight and bus depots first, then intercity routes, then nationwide coverage) and stronger subnational execution capacity.

    Three systems, not one policy, drove the shift

    Costa Rica shifted its capital stock toward knowledge-intensive production amid persistent physical infrastructure constraints. Electricity generation remained overwhelmingly renewable after 2015, anchored in hydropower and complemented by geothermal and wind power, laying the groundwork for low-carbon electrification. Fiscal reforms strengthened buffers, with debt declining from pandemic peaks and international reserves reaching historically high levels by mid‑2025. In tradables, the economy deepened its specialization in advanced manufacturing—especially medical devices—supported by FTZ infrastructure and sustained FDI inflows that recovered after the 2020 shock and reached high levels by 2024. Transport energy use remained dominated by liquid fuels because most vehicles still relied on internal combustion engines, even as new registrations shifted. The distinction is between rapid electrification in new private vehicles and slower, operations‑constrained electrification in high‑utilization segments such as buses, taxis, and delivery fleets. Those segments often deliver larger emissions and air-quality gains per vehicle but require depot charging, route planning, financing, and maintenance capacity. The dual reality is a clean-electricity base and fast-moving EV adoption at the margin, alongside a legacy fleet and public-transport systems that still drive emissions and dependence on fuel imports.

    Costa Rica focused institutional reforms on three domains: fiscal governance, decarbonization policy, and digital government coordination. In 2018, the legislature passed a major fiscal reform that introduced a spending cap and broadened taxation through a value-added tax framework, reshaping what the state could fund and how it could finance it. Also in 2018, lawmakers enacted an EV incentives law that created tax exemptions for EVs and charging infrastructure and assigned responsibilities for charging rollout and fleet transitions. In 2019, the executive launched a long-horizon decarbonization plan that set economy-wide direction and embedded transport electrification targets within a broader net‑zero pathway. In public administration, successive digital transformation strategies culminated in a 2023–2027 framework, and the state created a national digital government agency to coordinate interoperability and service delivery across institutions. These moves turned political intent into enforceable rules, multi-year plans, and implementation mandates that could survive electoral cycles.

    Economic and social outcomes shifted unevenly: growth strengthened alongside persistent labor-market duality and regional disparities. In 2020, tourism and contact-intensive services collapsed, unemployment surged, and household vulnerability increased. After reopening, export manufacturing, corporate services, and tourism drove the recovery, with unemployment falling to low single digits by late 2025. Informality remained high—about 40% of workers in several recent years—showing that productivity gains in the modern sector did not automatically translate into broad formalization. High-skill jobs and the export platform stayed concentrated in the Greater Metropolitan Area, while regional inequality motivated new territorial policy instruments, including a regional development law designed to strengthen regional planning and financing. The period combined macro stabilization and modern-sector dynamism with distributional frictions that complicate inclusive growth and the politics of sustained reform.

    The pandemic sorted winners and losers — and Costa Rica was ready

    By 2019, Costa Rica’s public health system had implemented a single nationwide digital health record, changing how clinics recorded visits, handled referrals, and interacted with patients. In transport, an EV incentives law and early charging corridors lowered the perceived risk of owning an EV and attracted private investment in EV models, chargers, and maintenance services. After the 2022 cybersecurity crisis, agencies improvised new coordination and operating practices under pressure, accelerating changes in how the state managed digital systems. When the pandemic hit in 2020, these were not contingency measures—they were already operating routines, which made them resilience assets rather than emergency responses. In evolutionary terms, these were sources of “variation”: policy experiments and shocks that introduced new routines in public services, mobility, and administrative coordination. The takeaway is that the highest-impact pilots were not symbolic; they were designed (or forced) to touch high-volume transactions and operational bottlenecks, so learning could accumulate quickly and be institutionalized.

    Selection is the filter that decides which experiments scale and which fade. In Costa Rica, the 2018 EV incentive law tilted relative prices toward battery-electric vehicles and helped EVs outcompete conventional vehicles where exemptions and operating costs mattered most. As more global manufacturers offered EV models and prices fell, competition expanded choice and lowered entry barriers. The pandemic acted as an economy-wide selection event: it punished tourism in 2020 while favoring export manufacturing and digitally enabled services that could keep operating. Fiscal rules and IMF-supported stabilization limited room for recurrent spending expansions, pushing the state toward reforms that improved compliance and efficiency rather than simply adding programs. OECD accession reinforced institutional upgrades by tying governance standards and peer expectations to membership. These filters favored tradable upgrading, digital service modernization, and electrified mobility—while making infrastructure delivery, skills supply, and implementation capacity the binding constraints.

    Diffusion is where Costa Rica’s story is most useful for implementation-minded readers: it shows how a pilot becomes “the way the system works.” In digital health, a single record and workflow moved from partial rollout to near-universal use by 2019. Clinics and hospitals stopped treating digitization as an add-on and treated the digital record as the default system of record for visits, prescriptions, and referrals. That shift required a multi-year bet: standardized processes and an implementation owner able to roll the system out site by site until coverage became routine. In electric mobility, diffusion looked like an ecosystem: as registrations rose, charging points expanded, dealerships broadened model lines, and early user experience reduced perceived risk for the next cohort of buyers. Diffusion sticks when rules are stable enough for private actors to invest, the service platform is visible to users (a record they must use, a charger they can find), and an accountable owner sustains execution through the unglamorous years of rollout. But diffusion at this scale doesn’t happen by accident — it requires a state that has converted political intent into durable rules and institutions, which is the subject of the next section.

    Rules outlast governments: how policy survived three elections

    Costa Rica made the transition durable by embedding long-horizon objectives in rules, standards, and market architecture rather than relying on ad hoc programs. The 2019 decarbonization plan defined a pathway to net‑zero by 2050 and translated it into sectoral commitments, with transport electrification as a central pillar. The EV law established a concrete incentive regime—tax exemptions and institutional obligations—that altered relative prices and clarified the responsibilities of agencies and utilities. The 2018 fiscal reform created binding constraints through a fiscal rule and tax base changes, narrowing the feasible set of public choices while strengthening credibility with lenders and investors. OECD accession in 2021 added a governance anchor, reinforcing continuity across areas such as competition policy, statistics, and institutional standards. These actions reduced uncertainty for investors and households and created a predictable environment for adoption and upgrading.

    The state backed the rules with enabling infrastructure and platforms, even as infrastructure quality remained a constraint. The national electricity utility (ICE) and the broader electricity system maintained near-universal access and a renewable generation base, giving Costa Rica a backbone for electrifying end uses without increasing power-sector emissions. After the EV law set rollout expectations, utilities and partners expanded public charging points as EV demand rose. In health, the public system financed and rolled out nationwide digital records and supporting applications through a multi-year effort. Telecommunications policy and regulator-led programs expanded broadband coverage, widening the user base for digital public services. In tradables, the state sustained the FTZ framework and export promotion institutions that helped attract and retain investment in life sciences and corporate services. Coordination across ministries, regulators, utilities, and promotion agencies aligned rules, investments, and execution—and often shaped outcomes as much as budget spending did.

    Costa Rica’s institutions learned by adjusting policies, carrying out reforms across administrations, and changing implementation practices after shocks exposed weaknesses. In 2022, policymakers revised the EV incentive regime and extended it through 2034, phasing benefits as the market matured and reducing the risk of abrupt withdrawal. After the 2022 cyber crisis, agencies changed how they govern and operate digital systems by introducing new coordination mechanisms and strengthening operational security for cross-agency response. Successive digital transformation strategies signaled a shift from isolated digitization projects to whole-of-government interoperability. In macro-fiscal management, the fiscal rule and post-pandemic consolidation kept stabilization mechanisms in place as debt ratios declined from their peaks. Institutions learned by recalibrating incentives as markets evolved, strengthening governance after failures, and retaining reforms that improved credibility and reduced fiscal risk.

    One episode illustrates crisis-driven learning: the 2022 cybersecurity attack disrupted core government digital services and forced leaders to treat cyber resilience as an operational problem rather than an IT add-on. Agencies responded by tightening incident-response routines (who declares an incident, who communicates, and how systems are isolated and restored), increasing cross-agency coordination, and strengthening continuity planning for critical services. Digital government scales safely only when the state invests in the backbone—security standards, shared monitoring, clear authority in a crisis, and practiced recovery procedures—alongside visible user-facing platforms.

    The lesson for LAC: sequence matters more than ambition

    The compounding dynamic shows up in outcomes. Growth dipped sharply in 2020 but rebounded with record growth in 2021 and remained robust through 2023–2024, reflecting resilience in tradables and recovery in services. EV adoption moved from near zero to a sizable share of new registrations by 2023–2024, supported by a stable incentive regime and expanding charging availability. Digital delivery proved feasible at scale in health services, where nationwide digital records and high usage normalized citizen interaction with state systems through digital channels. These outcomes show how an export base, clean power, and state capacity reinforce one another—while also revealing where constraints (skills, infrastructure delivery, and electricity-system resilience) become binding as adoption grows. The sequence that worked in Costa Rica—stabilize the fiscal position, anchor a renewable power base, build export sophistication, then layer in electrification and digital transformation incentives—is not a universal template, but the logic is: don’t let adoption outrun the infrastructure and institutions that make it durable. That is why the next phase is harder: as electrification and digital government move from early wins to economy-wide coverage, fiscal space, digital service capacity, and electricity-system resilience increasingly determine whether progress continues.

    The desired future state is an economy that sustains export upgrading while turning electrification and digitalization into broad productivity gains rather than enclave performance. That requires transport electrification to move beyond early adopters toward high‑utilization segments—buses, taxis, ride-hailing, municipal fleets, and logistics—while maintaining electricity reliability as hydrological variability increases pressure on the generation mix. It also requires digital government to move from flagship systems to routine, cross-agency interoperability so firms and households face lower transaction costs and better everyday service. On the labor side, narrowing skill mismatches and reducing informality would help tradable sophistication translate into broader income security and tax capacity. The practical question is not just “train more,” but “build pathways”: competency-based technical programs aligned with employer demand, paid work-based learning (apprenticeships/internships), portable certifications, and placement mechanisms that connect graduates—especially from outside the main metropolitan area—to formal jobs in export-linked firms and their suppliers.

    Policymakers can act by prioritizing measures that strengthen infrastructure-to-adoption feedback loops, reduce duality, and improve execution capacity across institutions—while adapting choices to national starting conditions (power mix, geography/scale, and available governance anchors). First, align workforce development with the export platform’s needs by moving from “training supply” to “training-to-job pathways”: co-designed curricula with employers, paid apprenticeships, short modular credentials in priority occupations, and placement support that connects trainees to formal jobs (including in supplier networks and outside the capital region). Second, protect the credibility of EV incentives while tightening delivery on charging corridor coverage and reliability so adoption does not outpace infrastructure—and treat public transport and fleets as the scale lever by pairing vehicle incentives with operator-ready enablers (depot charging, grid connections, maintenance training, and financing/procurement models that pay for uptime). In countries with fossil-heavy grids or weak reliability, pair EV scaling with a power-sector plan that improves firmness, affordability, and emissions intensity. Third, scale digital government by enforcing interoperability standards and institutional workplans, using platforms like digital health as templates for other high-volume services. Fourth, preserve macro-fiscal credibility by maintaining fiscal rule discipline while prioritizing high-return public investment to relieve infrastructure bottlenecks, strengthen electricity system resilience, and support productivity.

  • Guyana’s Oil Boom 2015 to Today: Fast Growth, Hard Choices

    Guyana’s Oil Boom 2015 to Today: Fast Growth, Hard Choices

    Guyana has moved quickly to put in place the core governance for its windfall — the Natural Resource Fund, a local content act, and a rapidly expanding public investment program — as production and revenues scale. The question now is whether these systems are performing well enough to govern a larger spending envelope and deliver results. The window for strengthening them is short because commitments are rising faster than institutions can mature.

    In Guyana, the period from the 2015 offshore discovery to today has produced one of the fastest economic transformations recorded in a small developing state. Recoverable reserves exceeding 11 billion barrels were rapidly converted into production, and nominal GDP rose from roughly USD 4.3 billion in 2015 to about USD 16.8 billion by 2023. After the first oil, real GDP growth surged during the base-effect years, often exceeding 40 percent annually; by 2024, growth remained extraordinary at 43.6 percent, and the IMF projected roughly 14 percent for 2025 as growth normalizes from explosive liftoff to fast expansion. Offshore output has also accelerated faster than earlier projections: after reaching about 616,000 barrels per day in 2024, production climbed to roughly 900,000 barrels per day by November 2025 following the start-up of Yellowtail (the fourth FPSO) in August 2025. Poverty and welfare outcomes, however, remain the defining political-economy test. Recent poverty measurement is publicly contested — with the government arguing poverty is below 20 percent and the IDB estimating 58 percent living below USD 6.85 per day — but all credible sources converge on the same core point: the distributional gap remains large, and converting macro growth into broad-based welfare improvements is the central challenge of the current mandate.

    The central policy question is whether Guyana’s institutions can keep up with its revenues. This analysis examines three dimensions of that question: what the Natural Resource Fund, local content rules, and capital-budget expansion have achieved — and where execution gaps remain; how the upstream contractual framework shaped the pace and structure of the boom; and what it will take for the state to translate growing revenues into durable services, diversification, and shared prosperity.

    Building institutions at pace

    Guyana is managing a historic-speed production ramp-up while building and stress-testing the institutions that must govern it. The risk is not neglect but implementation: spending and operational complexity are rising faster than oversight routines, procurement systems, and delivery capacity can fully keep pace.

    The scale of Guyana’s production ramp-up is without modern parallel for a state of this size. Offshore discoveries in the Stabroek Block — estimated at over 11 billion barrels of recoverable oil equivalent — were quickly converted from reserves into output, led by ExxonMobil as operator, alongside partners Hess Corporation and CNOOC. Production rose from zero in 2015 to about 400,000 barrels per day by 2022, reaching roughly 616,000 barrels per day by 2024. In August 2025, Yellowtail — the fourth FPSO — came online, and national production reached roughly 900,000 barrels per day by November 2025. The next wave is already scheduled: Uaru (fifth project) is expected in 2026, Whiptail in 2027, Hammerhead in 2029, and an additional project is under review. ExxonMobil now projects approximately 1.7 million barrels per day of production capacity by 2030 — a larger scale and arriving faster than earlier “late-2020s” projections implied. Petroleum has become the dominant driver of GDP, exports, and fiscal receipts, reshaping national economic aggregates faster than any domestic system — however capable — can fully adapt.

    The government moved quickly to build the institutional architecture needed to manage the boom. The Natural Resource Fund (NRF), established in 2019 and revised in 2021, created a formal framework for receiving, investing, and withdrawing oil revenues before they became material. The fund has also grown rapidly: it stood at roughly USD 3.1 billion at the end of 2024 and reached approximately USD 3.5 billion by early 2026. Notably, the IMF’s 2025 Article IV consultation explicitly commended Guyana’s rules-based management of the NRF — a useful counterpoint to the common worry that discipline weakens as fiscal space expands. The Local Content Act of 2021 mandated domestic participation across 40 categories of goods and services — an ambitious attempt to convert offshore wealth into domestic employment and business opportunities at speed. These are meaningful achievements. The practical constraint that follows from them is one of sequencing: institutions created while revenues are already flowing have less time for piloting and iterative refinement before they operate at a national scale. Rules and mandates can be solid on paper, while implementation capacity, oversight routines, and market readiness are still catching up.

    The social dimension of the boom has moved more slowly than the macroeconomy. Available evidence indicates persistently high poverty alongside rapid GDP growth, reinforcing perceptions that oil wealth is concentrated offshore and in coastal urban centers. These distributional concerns interact with real political pressures. The 2020 election integrity crisis — in which irregularities in the reporting of results were addressed through CARICOM and legal challenge — demonstrated that resource-era pressures test democratic institutions in specific and serious ways. That crisis was resolved, and Guyana’s institutions held. The lesson it leaves is that distributional expectations must be managed with demonstrable delivery: when citizens do not see the boom in their lives, political risk rises. Revenue debates are therefore becoming a central arena for accountability, and the government’s ability to show concrete results in health, education, and household welfare is directly linked to its political durability.

    The contractual framework and its consequences

    The 2016 Stabroek production-sharing agreement was negotiated when the block’s ultimate scale was unknown and deepwater frontier exploration carried genuine commercial risk. As production has far exceeded early projections, the policy priority has shifted: not renegotiation, but rigorous cost recovery oversight, disciplined fiscal management, and maximizing what the existing contractual framework can yield.

    The initial driver of change was technological and geological. Operators deployed advanced seismic imaging, subsea systems, and floating production technologies, unlocking high-quality, low-sulfur crude oil previously considered marginal. The emergence of FPSO-based development introduced a modular offshore operational model that differed sharply from Guyana’s historical economy of agriculture, mining, and forestry. In effect, deepwater technology created a viable petroleum export platform where none had previously existed.

    The contractual and market environment then rewarded speed and scale. Favorable production-sharing terms, high expected rents, and strong global investor appetite for low-cost, short-cycle projects created powerful incentives for rapid project sanctioning. Multiple FPSOs were approved in quick succession, enabling output to expand even amid global oil-price volatility. By 2022, oil production alone drove real GDP growth of 62.3 percent — the highest recorded globally that year. The contractual logic that produced this result also shapes the boundaries of near-term flexibility: approaches that would extend timelines, such as more stringent local-capability requirements or additional supply-side conditions, carry real execution risk and must be calibrated against delivery capacity.

    The gains from this model have diffused unevenly across the economy. Production capacity and offshore routines have scaled predictably, while the institutions that spread benefits onshore — public investment management, local supplier upgrading, and accountability mechanisms — require more deliberate support. Oil production is structurally enclave-prone: operators optimize for speed and tightly controlled supply chains, limiting automatic spillovers. Onshore gains therefore require deliberate channels: supplier development programs, skills pipelines aligned to industry demand, and local content rules that reward performance — quality, delivery, and learning — rather than participation alone. Cost recovery oversight is an immediate priority: rigorously scrutinizing recoverable costs is the fastest available lever to improve Guyana’s effective fiscal take under the existing agreement.

    Can the state keep up?

    The state has played a decisive and deliberate role in shaping this boom. Through project approvals and the acceptance of production-sharing terms, it created conditions that attracted large-scale investment while shifting exploration and price risk to private operators — a rational strategy given the risk environment of 2016. The result has been extraordinary production growth. The challenge now is that the same pace compresses the time available to test and refine the governance systems that channel revenues into public benefits. With capacity on track to reach roughly 1.7 million barrels per day by 2030, regulatory and fiscal institutions will need to operate at higher volumes, with faster project sequencing, and with rising contractual and operational complexity.

    Oil revenues have expanded fiscal space and enabled a surge in public investment: roads, energy infrastructure, health facilities, and schools. This is a serious coordination effort—public capital to lower costs for private activity and strengthen human-capital foundations. Whether it succeeds depends heavily on the quality of the implementation. Absorptive-capacity constraints — weak project appraisal, procurement bottlenecks, limited contract management capacity, thin monitoring and evaluation — can reduce value for money even when budgets are sound and intentions are clear. The gas-to-energy (gas-to-shore) project makes this risk concrete: first gas was originally expected by the end of 2024, slipped to 2025, and has since moved to mid-2026; reported costs rose from roughly USD 1.7 billion to USD 1.9 billion from a 2018 feasibility estimate of USD 478 million; and one contractor (CH4) left the partnership in July 2025. A second gas-to-shore project is already being advanced, underscoring how quickly the investment pipeline can compound. If these constraints are not addressed, the risk is not merely wasted money but hardened inequality: infrastructure that bypasses poor communities, contracts that flow to connected firms, and a gap between the headline story of prosperity and the lived experience of most Guyanese. The binding constraint may be implementation capacity rather than financing, especially as the investment pipeline continues to grow.

    Whether the state can keep up will depend on institutional learning and adaptive management. Local content rules and training initiatives have increased domestic participation, and local content employment has reached a meaningful scale: around 14,000 Guyanese are now directly employed in the oil and gas sector, with another 7,000 indirectly. The government is also revising the Local Content Act in 2025–2026 to raise targets and extend coverage beyond the oil sector. At the same time, much technical expertise remains foreign-supplied, and direct oil employment is structurally limited by the capital-intensive nature of production. The key transition is therefore from compliance-based local content to capability-based local content: using transparent registries, supplier-upgrading programs, and performance expectations that reward quality and learning. This requires feedback loops — routine measurement of what is working and what is not — so policies can be adjusted before lock-in makes correction costly. The IMF, World Bank, IDB, NRGI, and civil society are notably consistent on this point: the next phase is less about setting direction and more about iterating implementation capacity at speed.

    Five priorities for the next phase

    These five priorities are not equally urgent. Oversight and delivery capacity are the most time-sensitive: oversight shows whether systems are working, and delivery capacity determines whether spending produces results. Both become harder to build once spending has scaled and incentives have hardened. The remaining three priorities build on these foundations.

    Prioritize oversight of construction and transparent contracting while spending scales. The institutions that protect value for money — independent audit and fiscal oversight bodies, beneficial-ownership registries, transparent procurement, and cost recovery scrutiny — need to be fully operational before the investment pipeline doubles again. Oversight is not a governance formality; it is the mechanism through which the government can know whether its own programs are working. Without it, monitoring data is unreliable, course correction is guesswork, and the political cost of failures that could have been caught early falls on the administration that was too busy to look. Guyana has made progress here. The task is to make these systems fully operational in practice — staffed, funded, and empowered to act on what they find.

    Pace spending to what institutions can deliver. The central risk is not spending too little — it is spending faster than institutions can execute well. Roads abandoned halfway, hospitals built but not staffed, power plants commissioned without trained operators: these are the standard failures of oil booms, not hypotheticals. Before expanding the capital budget again, strengthen public investment management by ensuring rigorous project appraisal and prioritization, competitive procurement, construction supervision, and maintenance planning. Then direct spending toward education, health, and basic services — investments that raise productivity for decades regardless of oil prices. Absorptive capacity is not a bureaucratic detail; it is the binding constraint on whether the boom delivers lasting results.

    Make skills the engine of diversification — then remove the other obstacles. Diversification does not happen by hope or decree. It requires addressing specific, well-documented constraints: labor shortages and skill mismatches, unreliable infrastructure and power, and a business environment that discourages new entrants. Start with skills, because they take the longest and pay off most broadly. Fund teacher quality, expand STEM facilities, scale demand-linked training in engineering, construction trades, ICT, and energy systems, and develop the University of Guyana into an applied institution tied to national delivery priorities. Then work systematically through the infrastructure and regulatory constraints so that non-oil firms can grow, survive a price downturn, and eventually export.

    Protect fiscal space across the whole oil cycle. Chile’s copper story offers a relevant model: save more during boom years, avoid locking in recurrent spending commitments that cannot be sustained when prices fall, and maintain clear, predictable withdrawal rules for the Natural Resource Fund. Norway adds a complementary discipline: spend only real returns from the fund, not principal, so that revenues benefit future generations rather than being consumed in a single boom. Trinidad and Tobago’s experience is the most instructive cautionary case — geographically and institutionally closest to Guyana — where oil revenue crowded out the non-oil industry, diversification was deferred decade after decade, and the economy was left exposed when production declined. The key domestic risk is rent substitution: if oil revenues begin to replace rather than supplement tax revenue, the accountability relationship between government and citizens quietly erodes, and the non-oil fiscal base atrophies precisely when it will eventually be needed. Strengthen tax administration and broaden the non-oil base now, while the windfall provides the political space to do so.

    Turn Guyana’s climate position into a durable competitive advantage. Guyana’s Low Carbon Development Strategy — developed well before the oil boom — gives the country credibility in international climate forums that most petrostates cannot access. Combined with the world’s most intact tropical forest per capita, Guyana holds a genuine and rare claim to the carbon credit market. The task now is to make this fully operational rather than rhetorical: clarify the institutional home for LCDS implementation, scale forest-carbon revenue streams, and pair oil revenues with investments in reliable, low-carbon domestic power. Cheap, clean electricity is not only an environmental objective — it is the infrastructure precondition for data-intensive industries, manufacturing competitiveness, and the kinds of firms that can anchor a diversified economy. Oil finances the transition; the transition protects and extends what oil built.

    Guyana enters the next phase of its boom in a stronger institutional position than most oil states managed at this stage. The sovereign wealth fund exists. The local content framework exists. The investment program is underway. The framework is in place, but it needs to perform at the level the coming revenue volumes will demand. The decisions made in the next three years, on oversight, on spending discipline, on skills, and on fiscal structure, will determine whether this boom builds a resilient, diversified economy or leaves the familiar legacy of missed opportunity. Guyana has the tools. The task is execution.

  • Dominican Republic: economic booms can hide financial fragility

    Dominican Republic: economic booms can hide financial fragility

    In 2003, the Dominican Republic’s growth model collapsed, turning a boom into a national emergency. Three banks failed, depositors lost roughly US$2.2 billion, unemployment approached 20 percent, and the peso lost about half its value amid surging inflation. This was not a random accident: it was a sequencing failure—financial liberalization and fast credit growth ran ahead of the supervisory capacity needed to detect fraud, enforce prudential rules, and resolve weak institutions quickly. For today’s nearshoring and tourism agenda in Latin America and the Caribbean, the DR case matters because it shows how quickly headline growth can be erased when oversight is added after the fact.

    Between 1990 and 2005, the Dominican Republic shifted from protectionism toward outward‑oriented growth. By the mid‑1990s, trade liberalization had dismantled hundreds of import restrictions, unified the exchange rate, and opened all sectors to foreign investment. Export Processing Zones became the backbone of goods exports, accounting for more than four‑fifths of total exports by 2000, while tourism revenues more than doubled during the 1990s. By 2005, services employed over 60 percent of the workforce, and agricultural employment had fallen to just over one‑tenth—but the 2003 banking crisis showed how fragile these gains could be when oversight lagged market opening.

    Across Latin America and the Caribbean, nearshoring is reshaping where factories locate, and tourism is rebounding post‑pandemic—often faster than the institutions meant to regulate finance, utilities, and land use. The Dominican Republic’s 1990–2005 experience is a useful dress rehearsal: export processing zones and mass tourism delivered rapid growth, but the same investment push also heightened incentives for regulatory arbitrage and exposed supervisory gaps, connected lending, and hidden balance‑sheet risks. This post uses the 2003 banking crisis as the lens for interpreting the preceding boom—and for drawing lessons for today’s nearshoring and tourism agenda. It first shows how capital, institutions, and labor shifted as free zones and tourism scaled, then explains how incentive regimes and shocks reshaped what firms did and how dominant models spread, and finally shows where the state enabled scale while regulatory capacity fell behind.

    Capital and jobs shifted to exports and tourism

    Capital stocks and flows shifted decisively toward services, export manufacturing, and external finance. Physical capital expanded rapidly in tourism and export manufacturing, with hotel room stock rising from just over 7,000 in the mid-1980s to more than 45,000 by the late 1990s, and export processing parks increasing from a handful to more than 50 by the early 2000s. Foreign direct investment averaged around 4 percent of GDP, concentrated in tourism, telecommunications, and free zones. Financial inflows were complemented by growing remittance flows, which reached more than US$2 billion by 2004 and helped stabilize consumption during downturns. Human capital indicators improved in coverage, with gross primary and secondary enrollment rising by more than 40 percentage points between 1992 and 2002, even as average years of schooling among new labor market entrants remained low. Knowledge capital deepened mainly through imported routines and technologies embedded in multinational firms rather than domestic research, as national R&D spending remained negligible.

    Social institutions were reconfigured to support export orientation and private investment. New laws and agencies reshaped the institutional landscape, beginning with the creation of a comprehensive export processing regime that granted full tax exemptions to zone firms and defined a parallel customs framework. A decade‑long education plan doubled basic education spending and standardized curricula, expanding access even if quality gains lagged. Foreign investment legislation in the mid‑1990s eliminated restrictions on capital entry and repatriation, locking in openness across sectors. Partial privatization of state enterprises in energy and sugar shifted operational control to private partners while retaining public stakes. Financial regulation was modernized in 2002, but supervisory capacity proved insufficient to detect systemic fraud until the crisis struck.

    Social order and economic cycles were transformed through rapid sectoral reallocation and uneven distributional outcomes. Labor moved out of agriculture into services and export manufacturing, with agriculture’s employment share falling from roughly one‑quarter to just over one‑tenth between 1990 and 2005. Urbanization accelerated around tourism poles and industrial parks, reshaping regional economies and labor markets. Growth was rapid but uneven, with inequality remaining high and a significant share of the population living on low daily incomes even at the height of expansion. The 2003 banking crisis marked a sharp cyclical break, with unemployment nearing 20 percent and poverty rising as inflation spiked and the currency collapsed. By 2005, recovery restored growth but left lasting fiscal and social scars.

    Incentives and shocks chose winners as models scaled

    New export and tourism models took shape under incentive regimes. In plain terms, this section tracks which new business models emerged, which survived major shocks, and how the winners spread. Export Processing Zones introduced new organizational routines centered on offshore assembly for foreign markets, initially dominated by garments and light manufacturing. Firms experimented with production arrangements that split tasks across borders, gradually moving some operations toward higher‑value products such as medical devices. In tourism, foreign hotel chains standardized all‑inclusive resort models that integrated accommodation, food, and entertainment into a single routine. These experiments created a diverse set of production practices distinct from traditional agriculture and import substitution. Variation was largely driven by foreign firms responding to policy incentives rather than by domestic entrepreneurial discovery.

    Trade rules and shocks determined which sectors endured. Trade liberalization and export incentives removed anti‑export biases and selected for firms capable of competing internationally. Preferential access to foreign markets sheltered some activities, particularly apparel, until external conditions shifted. The expiration of global textile quotas in 2005 acted as a powerful selection shock, eliminating low-skilled garment producers and favoring more specialized manufacturing. The 2003 financial crisis functioned as a systemic selection event, forcing the exit of fraudulent banks and imposing new prudential standards on survivors. Together, these pressures determined which routines persisted and which were extinguished.

    Winning models spread through replication, rules, and training. Successful models spread geographically as industrial parks and tourism poles were replicated across regions. Vocational training institutions disseminated standardized production techniques from leading firms to the broader manufacturing base. Legal frameworks for foreign investment and free zones stabilized expectations and reduced policy uncertainty, embedding export orientation into the economic architecture. Tourism clusters achieved lock‑in through dedicated infrastructure and international marketing, reinforcing scale advantages. Diffusion favored breadth and speed over deep domestic integration, leaving enclave characteristics largely intact.

    Breaking the enclave is a design choice, not an automatic spillover. The DR experience suggests that zones and resorts will not deepen domestic linkages on their own: without explicit requirements and enabling institutions, investors optimize for speed, imported inputs, and tightly managed supply chains. Costa Rica offers partial evidence that governments can tilt incentives toward integration by tying benefits to skills pipelines and supplier development (for example, structured technical training partnerships, supplier certification support, and performance-based incentives that reward local procurement or technology transfer rather than simply granting blanket tax holidays). Honduras illustrates the opposite outcome: when zones expand under weak domestic capability and few linkage mandates, export jobs grow, but supplier networks and upgrading remain thin. For policymakers, the operational levers are concrete—attach time-bound incentives to measurable linkage targets, fund supplier-upgrading programs and standards labs that let local firms meet lead-firm requirements, and build training compacts that move workers into higher-skill tasks inside and beyond the zone.

    State incentives scaled growth, while oversight lagged

    The state provided direction and market rules that reshaped incentives and reduced policy uncertainty. Early reforms articulated a clear shift toward outward‑oriented growth through trade liberalization, exchange‑rate unification, and the removal of price controls. Export processing and tourism laws establish enforceable incentive regimes with clear eligibility and duration, providing investors with predictable conditions. Tariff simplification reduced dispersion and lowered maximum rates, reinforcing openness. These measures were sequenced to dismantle protection before scaling incentives, reshaping market signals across the economy. The direction was clear, even as oversight capacity lagged behind market expansion.

    Public investment and coordination mobilized private capital and concentrated growth spatially. State agencies identified and serviced priority tourism regions with basic infrastructure, enabling private hotel investment to scale rapidly. The government directly owned shares in industrial parks, lowering entry barriers for manufacturers while crowding in private operators. Partial privatization in energy and airports mobilized foreign capital and management expertise, though operational challenges persisted. During the crisis, the state absorbed massive financial losses to protect depositors, stabilizing the system at high fiscal cost. Coordination succeeded in mobilizing scale but struggled to manage risks.

    Institutional learning was reactive, shaped more by crisis than by systematic evaluation. The banking collapse forced a rapid overhaul of supervision, audits, and resolution frameworks, embedding new rules into law and practice. Fiscal policy shifted from generalized subsidies to targeted social assistance programs after 2003, improving the precision of social support. Program interruptions and restarts revealed the influence of political cycles on reform implementation. Learning occurred through failure rather than through continuous monitoring, with limited evidence of ex ante policy evaluation. Adaptation improved resilience but did not fully address underlying structural weaknesses.

    Export and services growth requires credible supervision and domestic linkages

    The strongest evidence shows that export processing and tourism can drive rapid growth when paired with credible liberalization. The Dominican Republic achieved one of the fastest growth episodes in the region by combining openness, incentives, and foreign investment. Structural change reallocated labor and capital toward higher‑productivity activities, transforming the economic base. Legal and institutional reforms locked in investor confidence and enabled scale. At the same time, weak financial oversight allowed systemic risks to accumulate.

    The desired future state is one where growth is matched by institutional depth and domestic integration. Sustained expansion requires financial systems that detect and deter risk before a crisis. Export and tourism regimes need stronger linkages to domestic suppliers and skills formation to deepen value creation. Social protection systems must adjust automatically to shocks rather than expand only after a crisis. Stability depends on aligning growth engines with institutional capacity.

    Policymakers should act on a focused set of priorities grounded in this experience. First, sequence market opening with supervisory strengthening, especially in finance and utilities, because in the DR, Banco InterContinental’s hidden, off‑balance‑sheet liabilities went undetected as auditors were captured and supervisory reporting was not routinely cross‑validated across institutions and payment systems. Second, redesign export and tourism incentives to reward domestic sourcing and skills upgrading—because free zones and all-inclusive resorts scaled quickly but retained enclave characteristics, with limited supplier linkages and spillover of learning occurring only where training institutions deliberately transmitted standardized techniques beyond lead firms. Third, invest early in monitoring systems that track systemic risk and distributional outcomes—because the 2003 break was preceded by rapid credit growth, connected lending, and widening balance‑sheet mismatches, while labor reallocation and crisis inflation translated quickly into unemployment and poverty; fourth, institutionalize policy evaluation to convert learning‑by‑failure into learning‑by‑design—because key upgrades in supervision and social protection came only after the crash, rather than through regular stress tests, independent reviews of incentive programs, and pre‑committed triggers for tightening rules when risk indicators flash red.

  • Brazil’s Cerrado Growth Model: State Capacity and Land Governance

    Brazil’s Cerrado Growth Model: State Capacity and Land Governance

    In 1960, Brazil imported food. In 2023, it supplied global markets at a scale that rivals the European Union’s agricultural exports. The Cerrado—roughly 200 million hectares—was long treated as marginal land; what changed was not the savanna but the state machinery around it. Brazil built public agricultural research and development, subsidized credit, and enabled infrastructure that made frontier production bankable and scalable. That same toolkit is available across Latin America and the Caribbean (LAC), where governments face a simultaneous mandate: raise output, defend climate credibility, and avoid a new wave of land conversion that triggers social conflict and ecosystem loss.

    The core policy problem is a sequencing gap: growth instruments move faster than land and social governance, so expansion outruns control. Brazil’s agricultural total factor productivity (TFP)—output growth not explained by more land, labor, or capital—grew at roughly 3% per year from the mid‑1980s to 2010, and soybean yields roughly doubled from the 1970s to the 2010s. Since 2000, studies commonly find that about 70–80% of new cropland came from converted pasture and 20–30% from native vegetation, with the higher‑risk share concentrated near frontier zones between the Cerrado and the Amazon. The cadaster (the official parcel-level land registry) and enforcement capacity improved more slowly than credit and logistics, so regulators often could not screen projects quickly enough to prevent illegal clearing or high-risk siting. The mechanism is frontier spillover pressure or indirect land-use change: when cropland expands onto pasture, displaced pasture and land speculation can shift pressure toward frontier areas, even if direct conversion appears to slow.

    The implication for LAC is operational: treat land governance as a binding constraint on how fast you can safely scale output. Start by expanding cadaster coverage, clarifying tenure, and funding enforcement so the state can deny permits, credit, and public benefits to noncompliant expansion before capital locks in land‑use patterns. Then design demand and finance tools to reward low land impact rather than volume, using performance screens and differentiated support that investors can understand, and regulators can audit. This requires an eligibility gate—a hard requirement that projects demonstrate clean land status before receiving public finance or permits—so inclusion and environmental safeguards are built into scale rather than layered on afterward. This blog examines what changed in Brazil during this process, what drove those changes, and the role of the state in guiding them. 

    How governance lagged investment

    Investment support created a lock-in by paying for long-lasting assets—roads, storage, ports, plants, and machinery—that required high, steady output to remain profitable. Subsidized credit, public risk absorption, and private balance sheets financed frontier roads and storage, export terminals, processing plants, and on‑farm machinery. Those assets lowered delivery costs and increased returns to scale, so producers and processors pushed for higher volumes to pay back what they had already invested. The evidence is clear in the timeline: Brazil moved from a food importer to an export-scale supplier, and infrastructure helped maintain that scale. Once these assets were in place, land became the hard limit, and expansion shifted toward the lowest-friction options, especially pasture conversion.

    Brazil built stronger institutions for productivity than for land control, so output rose before governance caught up. In the 1970s, Brazil established Embrapa to build domestic capacity in tropical science. Estimates commonly place Embrapa’s social return on investment at 7:1 or higher. Those capabilities supported sustained productivity gains, including TFP growth of roughly 3% per year from the mid‑1980s to 2010. Land institutions—cadaster quality, tenure clarity, compliance monitoring, and enforcement—improved more slowly, so the state often could not verify where and how expansion occurred. The result was a familiar imbalance: investment and offtake could scale in years, while land governance improved much more slowly. 

    The growth model shifted power toward actors who control capital, logistics, and compliance. As land values rose and processing and export logistics clustered, large producers, traders, and processors gained influence over standards, credit terms, and where infrastructure went. The spread of flex‑fuel vehicles after the early 2000s broadened a political coalition around fuel consumers and stabilized parts of the modernization agenda. Smallholders lost ground—literally—as land values rose near new roads and processing plants, concentrating benefits among actors who already had capital and logistics access. This pattern matters for LAC because once these coalitions form, tightening land governance later becomes more politically and financially costly. The actors who captured most of the gains were not those on the frontier — they were the traders, processors, and logistics firms that controlled the chokepoints between the field and the market.

    How scale got selected and locked in

    Variation expanded the feasible production set in the Cerrado by turning agronomic uncertainty into testable options that producers could adopt or discard. In the 1970s, Embrapa and partner networks generated multiple packages—soil correction (liming and nutrient management for acidic soils), new cultivars, and livestock genetics—rather than a single blueprint. Producers then experimented across crops and systems (soy, sugarcane, and livestock) under frontier conditions where initial yields were uncertain. The outcome was a widened feasibility frontier: by the 2010s, soybean yields had roughly doubled relative to the 1970s baseline, making large areas commercially viable. This mechanism matters for LAC because public research and development can quickly expand “what is possible.” Still, it also accelerates the speed at which land becomes contested if governance capacity does not scale in parallel.

    Policy picked the winners—and it picked the ones that could scale, document output, and plug into existing export channels. Subsidized credit and standards increased returns to producers who could meet specifications and deliver volume through established trading and processing systems. Where governments added demand-side tools (for example, ethanol blending), they created a large, policy-stabilized outlet; by the mid-2010s, ethanol displaced roughly 45–50% of gasoline demand in Brazil’s light-vehicle fleet. The result was concentration: capital‑intensive models dominated because they best matched the incentives embedded in credit, infrastructure, and offtake (a guaranteed purchase obligation) rules. This logic applies beyond fuels: any subsidy tied to guaranteed buying can push scale faster than land oversight can keep up with managing land spillovers. 

    Brazil did try to use a biofuels policy for inclusion. Biodiesel programs included family-farm participation requirements, but they did not materially shift the production structure once mandate volumes scaled up. Similarly, soy, with logistics advantages and existing supply chains, absorbed compliance demand faster than targeted suppliers could expand to meet it. The lesson is not that inclusion provisions are wrong; it is that volume-scale mandates overwhelm symbolic participation targets. Inclusion must be built into the eligibility architecture before scale, not layered on top afterward.

    Diffusion locked the model in by making it routine across supply chains, finance, and infrastructure. Processors standardized contracts, banks repeated the same lending templates, and logistics investments lowered delivery costs, enabling the package to replicate across municipalities. Offtake reduced demand risk and sped up replication, especially when policy tools stabilized outlets. Governance fell behind—regulators could track yields, not where the frontier was moving—so enforcement and screening did not keep pace with expansion incentives. The result was persistent land competition and frontier spillover pressure because the system kept rewarding expansion faster than land oversight could respond. 

    What the state did – and in what order

    State coordination mattered because Brazil could align rules and markets and mobilize private investment faster than frontier governance could mature. The state used standards and credit conditions to make production and processing investments viable, and sometimes used demand tools, including ProÁlcool (Brazil’s 1975 national ethanol program, which mandated blending, financed mills, and sustained demand through price policy) and ethanol blending rules. The mechanism is capacity, not intent: when agencies coordinate across agriculture, energy, and trade, they reduce uncertainty and speed up scaling. The risk for LAC is that if land administration cannot coordinate with these growth levers, expansion outruns verification and enforcement. 

    Public investment and finance facilitation accelerated Cerrado expansion by lowering risk and financing scale-critical assets. Brazil invested in applied science and extension capacity, and it used subsidized credit and public risk absorption to crowd in private finance once profitability was realized. These tools amplified scale by reducing capital costs for frontier logistics, processing, and on-farm modernization. The governance implication follows from the post-2000 land-use pattern: studies commonly find that 20–30% of new cropland originated from native vegetation in frontier zones, even though most expansion occurred through pasture conversion. For LAC, this means finance and infrastructure programs should scale only as fast as land verification capacity can screen eligibility and enforce penalties.

    Brazil raised productivity by building a learning system that repeatedly solved practical problems, rather than through a one-time technology transfer. Embrapa conducted long-term research in soil chemistry, breeding, and livestock genetics. Learning‑by‑doing—cost reductions and process improvements from repeated production and scaling—then spread routines through processors, input suppliers, and logistics networks. The measurable result was sustained productivity growth and large yield gains. The limiting factor was coordination and governance: higher yields do not prevent land conversion unless cadaster, enforcement, and screening capacity expand at the same pace as the technologies and the capital they attract. 

    Policy actions for LAC

    LAC’s challenge is to grow farm output without letting weak land rules turn that growth into land loss and credibility problems. Brazil shows how quickly growth policy can work. Brazil also shows why land rules must set the pace for scaling. Frontier spillover pressure raised risk when pasture displacement and frontier dynamics pushed expansion outward. The mechanism is simple: when credit, infrastructure, and guaranteed buying move faster than the official parcel-level land registry and enforcement, expansion outruns verification.

    Success looks like raising productivity on land that is already cleared, rather than expanding the farmed area. That path is realistic: Brazil sustained TFP growth and achieved large yield gains, including roughly doubled soybean yields. It also requires practical land administration: an official parcel-level land registry with high coverage, clear tenure records, and routine compliance checks that can block noncompliant projects from credit, permits, and procurement. Demand can still grow, but it must follow the rules; ethanol displacing roughly 45–50% of gasoline demand shows how fast policy can create outlets, so land checks must come first. The goal is durable growth that can pass climate and trade scrutiny because it is documented and enforceable.

    Before expanding mandates, concessional finance, or procurement, policymakers should put in place three requirements: an eligibility gate, performance-based incentives, and enforceable inclusion. The eligibility gate is a hard rule: projects must show clean land status before they can receive public finance or permits, using land-registry checks, tenure verification, and the ability to deny credit, permits, and public purchasing when land records do not clear. Use performance-based incentives by offering better subsidy rates or credit terms to producers with a smaller land footprint and, where relevant, lower lifecycle emissions verified through measurement, reporting, and verification—the same measurement systems required by carbon-market buyers and climate-finance providers—rather than paying for volume. Make inclusion enforceable by requiring payment of any social premium only when audits confirm the existence of real contracts, on-time payments, and a functioning grievance process. Colombia’s expanding palm sector and Bolivia’s shifting soy frontier face this sequencing choice now: scale only what you can verify and enforce, because once sunk assets accumulate—as they did in Brazil from 1960 to 2023—reversal becomes politically and financially expensive.

  • The Discipline Behind the Miracle: Learning from Taiwan and Korea

    The Discipline Behind the Miracle: Learning from Taiwan and Korea

    Many industrial policies share a common flaw: they are designed for success and unprepared for failure. Subsidies get extended, protection becomes permanent, and development banks accumulate risk without a clear plan to exit. Taiwan and South Korea’s experience between roughly 1955 and 1990 offers a structurally different model. In one generation, both converted agrarian economies into world-class exporters—showing that late-industrializing states can scale manufacturing capabilities rapidly when policy ambition is matched by institutional discipline.

    The core mechanism was not simply “more state,” but concentrated state authority over credit and trade, paired with hard performance tests. Governments steered finance, foreign exchange, and incentives toward priority sectors—and then used export results, investment targets, and periodic restructuring to cut losses and redirect capital when bets failed. Its relevance today lies in what both states got wrong as much as what they got right: rapid gains that concentrated risk, requiring painful restructuring later. Korea’s heavy and chemical industries’ rapid expansion in the 1970s produced overcapacity and non-performing loans that contributed to the 1979–80 crisis, followed by restructuring. Taiwan faced mounting pressure in the 1980s as labor-intensive exports lost competitiveness, forcing upgrading.

    The lesson for LAC is therefore less about replicating Korea’s conglomerates or Taiwan’s SME networks than about building the public-finance and planning routines that make industrial policy reversible: clear objectives, measurable milestones, and credible exit and restructuring rules. In both economies, instruments evolved over time—shifting from tighter vertical targeting toward more horizontal, capability-building policies in the 1980s—without abandoning outward orientation. Korea eased its most directive tools and restructured chaebol after 1979–80; Taiwan adopted a 10‑year economic plan in 1980 to steer upgrading toward technology‑intensive sectors. The sections that follow document what changed, what drove it, and how the state governed the process.

    What changed (1955–1990): the shape of structural transformation

    Industrialization shifted capital stocks from agriculture toward manufacturing and tradable industry. This reallocation was reinforced by outward‑oriented flows of goods, finance, and knowledge. Export earnings financed the import of machinery, thereby raising productivity and enabling further investment. Rising domestic savings deepened this accumulation loop. In Korea, commodity trade expanded from roughly US$480 million in 1962 to nearly US$128 billion by 1990, while domestic savings rose from about 3 percent of GNP in 1962 to over 35 percent by 1989. In Taiwan, exports accounted for a large share of non‑food manufacturing growth in the 1960s, and total trade increased nearly tenfold in the 1970s.

    Both states rebuilt social institutions to support export‑oriented industrialization. Planning agencies, trade regimes, and financial systems were redesigned to privilege industrial upgrading. Control over banking and foreign exchange allowed governments to steer investment toward priority sectors. Institutional designs diverged in form but not in intent. In Korea, five‑year plans, the National Investment Fund, and the Korea Development Bank channelled credit to steel, shipbuilding, machinery, petrochemicals, and electronics after 1973. In Taiwan, exchange rate reform in 1958–1960, export processing zones in the 1960s, and a 10-year economic plan adopted in 1980 structured export promotion and technology upgrading.

    Structural change reshaped social coalitions and distributional outcomes. Export‑oriented growth expanded urban employment and new middle classes while reducing agriculture’s economic role. At the same time, sectoral and regional disparities intensified. Periodic crises forced the renegotiation of coalitions. In Korea, factories in Seoul and surrounding regions accounted for nearly half of manufacturing value added and employed almost half of factory workers by the late 1970s. In Taiwan, sugar and rice declined to about 3 percent of exports by 1970, shifting rents and political influence toward industrial and small to medium-sized enterprise interests. For LAC, this political-economy channel is not incidental: reform efforts—from phasing out agro-industrial protection to restructuring energy subsidies—often fail or stall when governments underestimate how quickly rents and regional power bases shift during structural transformation.

    What drove the changes: experimentation, selection, and upgrading

    Both economies generated variation through policy and organizational experimentation. Early import‑substitution strategies were tested and then abandoned as constraints emerged. Export promotion created new competitive environments that encouraged further experimentation. The analytically powerful contrast is that Korea and Taiwan converged on the same goal—solving the coordination problems of scale, finance, and capability upgrading—through two divergent firm structures. Taiwan’s export boom was coordinated through dense networks of small and medium-sized firms (SMEs) and flexible subcontracting. At the same time, South Korea solved the same scale‑and‑coordination problem through large, vertically integrated chaebol (large, family-controlled conglomerates organized as diversified groups of affiliated firms, historically supported by close ties to state-directed finance) backed by state‑directed credit. This is not a historical curiosity; it maps directly onto a live LAC design tension: whether states should back national champions (e.g., Brazil’s BNDES-style approach; Chile’s large copper firms) or build ecosystems that help many smaller firms scale (e.g., the Dominican Republic’s export processing zones; Costa Rica’s tech‑linked upgrading). The lesson is not that one structure is universally superior, but that each requires different instruments to coordinate investment—and different forms of discipline to prevent support from becoming permanent.

    Selection operated through state‑mediated credit allocation and international markets. Access to subsidized finance depended on meeting export and investment targets. World‑market competition filtered out firms and sectors unable to meet price and quality standards. Political reassessment followed failure. In Korea, subsidized credit was rationed through state‑controlled banks and withdrawn from underperforming firms during the 1980s restructuring. In Taiwan, preferential credit, tax incentives, and access to export processing zones rewarded firms that succeeded in export markets. Once successful, export‑oriented industrialization diffused and became entrenched. Institutional routines reduced the cost of repeating outward‑oriented strategies. Learning by doing and sunk investments created path dependence. Core features were adjusted but not abandoned. Taiwan’s growth acceleration began around 1962 and lasted for more than three decades, with real GDP growth averaging roughly 8–9 percent per year through the early 1980s. Korea maintained an export-oriented approach from the early 1960s through the 1980s, despite scaling back vertical industrial policies after the 1979–80 crisis.

    How the state guided change: credit, trade, and discipline

    The state provided clear direction and engineered market rules to align private incentives with national goals. Strategic coordination was exercised through multi‑year plans and central agencies. Trade and exchange‑rate regimes were redesigned to favor exports. Regulatory architectures shaped firm behavior. Korea’s Economic Planning Board, created in 1961, coordinated five‑year plans and export targets across ministries and banks. Taiwan’s exchange rate reform in 1958–1960 and the export promotion statutes of the 1960s restructured market incentives toward outward orientation.

    Public investment provided the infrastructure and human capital needed for industrial-scale production. Both Taiwan and Korea expanded technical and vocational training—and strengthened engineering education—to match the skill needs of export manufacturing and technology upgrading. State‑controlled finance mobilized savings and absorbed risk in priority sectors. These interventions enabled large, long‑gestation projects. They also concentrated fiscal and financial exposure. In Korea, public and public‑enterprise investment accounted for roughly 40 percent of total domestic investment between 1963 and 1979, with major spending on power, ports, and transport. Korea’s domestic savings rate rose from 3.3 percent of GNP in 1962 to 35.8 percent by 1989, channelled through controlled banking systems into industry.

    Innovation systems emerged through learning‑by‑doing within export‑oriented ecosystems. Acquisition and adaptation of technology were prioritized over frontier invention. Organizational forms shaped how learning diffused. Policy feedback adjusted support mechanisms over time. In Korea, targeted support for steel, shipbuilding, and electronics enabled chaebol to become global players by the mid‑1990s. In Taiwan, public technology institutions—most notably the Industrial Technology Research Institute (ITRI)—helped absorb foreign know‑how, incubate new capabilities (especially in electronics), and diffuse process and design improvements across networks of SMEs.

    The practical implication for LAC is not a single template but a shared design principle: the organizational form matters less than the discipline built around it. Korea’s chaebol and Taiwan’s SME networks succeeded not because one structure is superior, but because each was embedded in credible performance tests—and governments were willing to act when those tests were failed. 

    Implications for LAC 

    For finance and planning ministries, the Taiwan–Korea comparison is most relevant as a lesson in state capacity to coordinate investment under hard budget constraints. Both countries solved early coordination failures by steering credit, trade incentives, and planning priorities—but they did so with clear performance tests and a willingness to restructure when bets went wrong. The LAC takeaway is that any modern industrial or productive‑development push (nearshoring, energy transition, strategic minerals, advanced services) must be designed as a fiscally legible program: explicit objectives, quantified milestones, transparent costs (including tax expenditures), and a credible plan to manage fiscal risks arising from public banks, guarantees, state-owned enterprises, and public-private partnerships.

    A second implication is to recreate “export discipline” using instruments that sit squarely within finance and planning systems. Rather than open-ended protection, support should be conditional and time-bound—linked to verifiable indicators such as export survival, productivity, formal job creation, certification/quality adoption, and integration into higher-value-added segments of value chains. Ministries of Finance can operationalize this through results-based transfers and credit lines, rules for tax incentives (ex-ante costings, publication, and periodic review), and procurement that rewards performance and innovation while preserving competition. Planning ministries can align these tools with a national investment pipeline and a small set of priority missions that are revised as capabilities change.

    Finally, the institutional lesson is to treat structural transformation as a governed portfolio of experiments. For finance and planning authorities, the priority is not picking winners once but building routines to allocate, monitor, and exit public support in a way that protects the sovereign balance sheet. That, in turn, means agreeing on a single results framework with a short list of metrics; funding independent evaluation and public reporting; writing sunset clauses and restructuring triggers into programs from the outset; and maintaining fiscal-risk oversight of development banks, SOEs, and PPPs—including stress tests and caps on guarantees. Done well, this shifts LAC policy from ad hoc deals toward credible commitment: investors get stability and coordination, while governments retain the ability to correct course when external conditions tighten.

    Taiwan and Korea show that state-led transformation is possible—but not as a permanent arrangement. Both states eventually had to let go of favored sectors, protected firms, and comfortable credit concentrations. The question for LAC is not whether governments can pick priorities, but whether they can build the institutional reflexes to revise them. That capacity doesn’t emerge from good intentions. It must be designed from the start.

  • Why Reforms Fail: Five Functions for Change in LAC

    Why Reforms Fail: Five Functions for Change in LAC

    In 2013, Mexico’s energy reform looked like a textbook transformation package: a clear legal opening, new regulators, competitive processes to attract investment, and the promise of cheaper, cleaner, more reliable power. Within a few years, the trajectory shifted. Rules were contested, permits and contracts became politicized, and investors faced rising uncertainty. The problem was not just “policy design.” Distributional conflict, institutional veto points, capacity constraints, and credibility gaps made implementation fragile and reversals politically feasible. The lesson for governments across Latin America and the Caribbean (LAC) is straightforward: even reforms that look right on paper can fail to deliver. Institutional change only holds when legitimacy, coalitions, coordination, and learning under uncertainty are managed as an integrated pathway.

    Cases like this show that the core problem is less a lack of ideas than a lack of execution discipline across interdependent steps. Institutional change must be managed as a coordinated sequence in a contested environment. When transformation is treated as a long list of separate reforms, leaders lose clarity on what comes first, what must run in parallel, and what must be sustained long enough to become routine. They also struggle to reduce uncertainty about impacts and costs. Resistance then becomes predictable—distributional conflict, bureaucratic turf wars, capability gaps, and private interests seeking exemptions or delay. The result is familiar: partial progress, missed complementarities, and ad hoc trade-offs. Credibility erodes, and the package underperforms.

    A coherent approach starts by making the pathway explicit. It turns a complex agenda into manageable blocks that you can share, sequence, and run. I propose five state functions. These five functions don’t overlap, and you can’t skip any of them: strategic vision, market shaping, public investment, coordination and capital mobilization, and adaptive learning. Read as a change pathway, they clarify what governments must put in place. Vision sets direction, market shaping creates the rules and incentives that make it possible, investment turns intent into delivery, coordination keeps everyone aligned, and learning builds in feedback and adaptation. When these functions align, they create reinforcing loops that build capability and credibility. When they do not, predictable failure modes follow—misallocation, reversals, and erosion of trust.

    Why transformation efforts stall: complexity, silos, and partial diagnostics

    Development theories illuminate important state roles. Each tends to focus on a subset of functions rather than offering a complete map for transformation. Developmental state theory emphasizes long-term vision and coordination, but it underplays institutionalized learning and adaptation. Innovation systems theory highlights networks and knowledge flows, yet it treats the state as an implicit actor and offers limited guidance on direction-setting or market creation. New institutional economics foregrounds property rights and the enforcement of rules. It often says less about how states actively shape markets or build productive capabilities. No single framework is jointly exhaustive. Policymakers who apply any of them in isolation will overlook critical functions for sustained change.

    Standard diagnostics often reinforce the problem by treating governance, regulation, finance, and investment as separate silos. They can tell you whether rules are clear, procedures are followed, and projects are well costed. They rarely ask whether the government knows where it is going. They also rarely ask whether institutions are aligned to sustain delivery, or whether the system can learn and adapt when things go wrong. Targeted political economy work can help by identifying who stands to lose (or gain), which agencies can block implementation, and which groups can mobilize against change—such as state-owned enterprises, public-sector unions, or concentrated industry lobbies. But operational evidence still struggles to accumulate into system-level learning without a unifying functional architecture.

    Disconnected reform tracks produce predictable results. They weaken sequencing and suppress learning, which lowers the returns to reform and investment. Resistance and capture risks amplify the damage. Reforms that threaten rents can trigger pushback from incumbent firms, privileged contractors, or protected state-owned enterprises; agencies also protect turf, and weak accountability increases the risk of corruption. Countries may improve governance indicators without achieving a productivity takeoff. Missing functions—especially coordination and capability-building—often explain the gap. Ambitious investment or industrial strategies can also falter. Weak regulation, accountability, or learning then produces misallocation, capture, and backlash. Learning is rarely treated as an explicit state function. Failures persist without correction, and successes are not systematically scaled. The net result is low and volatile returns. Skepticism about state-led transformation grows.

    The five functions that drive institutional change

    Governments need a simple way to describe what must be done and how the pieces fit together over time. The goal is not simplification for its own sake. It is a pathway that is complete enough to guide execution in the real world. Structural change requires five distinct state functions that cannot be collapsed into isolated policies. Progress depends on moving through them as a coherent sequence, not as independent checkboxes. The sequence also helps manage uncertainty and resistance. Credible direction builds legitimacy, enabling rules to reduce discretion and rent-seeking; early delivery builds confidence; coordination brokers compromises; and learning course-corrects when assumptions fail. The model identifies five functions: strategic vision, market shaping and regulation, investment and service delivery, coordination and capital mobilization, and adaptive governance and learning. Each corresponds to a different mode of state action—choosing direction, setting rules, allocating resources, aligning actors, and adjusting in response to feedback. Together, they describe how change is initiated, implemented, and sustained. The absence of any one function can derail transformation even when others are strong.

    Recent LAC experience shows how a missing function can derail change. In Mexico, shifts in strategic direction weakened legitimacy and raised regulatory uncertainty after the 2013 energy opening. Weak enabling rules and oversight can also turn programs into rent opportunities. Brazil’s Petrobras contracting scandal illustrates how discretion and weak controls can corrode performance and trust. Delivery gaps can be just as damaging. In Haiti, repeated difficulties translating reconstruction and service commitments into sustained results eroded confidence. Coordination failures can stall implementation even when the direction is clear. In Colombia, implementation of the peace accord has faced coordination and financing bottlenecks that have slowed delivery in territories. Finally, weak feedback and adaptation can lock in underperforming policies. Argentina’s repeated cycles of price controls and ad hoc subsidies show how reversals can substitute for learning.

    The model is designed so that each function is distinct, yet together they cover the full spectrum of state roles. That is what makes it useful as a practical change sequence. Strategic vision concerns choosing ends. Market shaping governs rules and incentives, while investment focuses on direct provision and asset creation. Coordination and accountability manage cross-government incentives, distributional conflict, and capital mobilization across institutions. Adaptive learning institutionalizes feedback and adjustment over time. The literature maps unevenly onto these functions. Most approaches emphasize some functions but not others, which is why partial diagnostics persist. For policymakers, the implication is practical. Durable change often fails when a single block is missing, even when other reforms are advanced.

    Development outcomes depend on alignment and feedback across functions, not excellence in any single domain. Momentum must also carry early actions into institutionalized routines. Strong public investment without market discipline or accountability raises fiscal risk and lowers returns, as repeated LAC debt cycles show. Strong regulation without investment and coordination can also disappoint. Productive capabilities remain underdeveloped when delivery and alignment are weak. The model treats transformation as a system. Vision focuses effort, shaping the market enables action, investment delivers tangible progress, coordination provides the glue that holds the institution together, and learning embeds adaptation, so gains persist. Uruguay’s renewable energy transition is a useful counterexample. A clear direction, stable market rules (including auction design), credible delivery of new generation, effective coordination among public entities and investors, and ongoing learning sustained rapid change over time. This logic explains why fragmented reform packages underperform despite isolated improvements.

    How the model improves diagnosis, sequencing, and credibility

    A functional lens turns diagnosis into a plan. It shows which block in the change pathway is missing and where the capability is binding. By assessing performance across the five functions, analysts can identify whether stagnation reflects weak vision, poor market shaping, thin delivery capacity, coordination failures, or missing learning mechanisms. That is more actionable than sectoral or institutional checklists. In LAC, many countries strengthened rule-of-law and regulatory indicators, yet failed to diversify or innovate. Gaps in vision and learning often explain why governance improvements did not translate into transformation.

    The model also operationalizes political economy and financial constraints. It supports realistic sequencing from enabling conditions to delivery to durability. Sequencing choices—such as whether to reform regulation before scaling investment, or to pilot before scaling—should be evaluated based on functional readiness, not ideology. Many failures are not technical. They reflect veto points, distributional conflict, and credibility problems—for example, resistance from public-sector unions, pushback from incumbent utilities or other state-owned enterprises, or pressure from export industry lobbies for exemptions and special regimes. Pilots, phased implementation, and transparent risk governance can reduce uncertainty and lower resistance. They clarify who bears costs and how risks are managed. Large-scale capital mobilization without credible oversight can create contingent liabilities and credibility loss. Repeated renegotiations and legal disputes in some LAC transport concessions show how weak risk allocation and accountability can undermine long-term credibility. By linking finance, accountability, and learning, the model helps governments manage trade-offs transparently and sustain momentum beyond the first wave.

    Learning strengthens credibility by turning reform into a self-correcting routine. It also raises long-run impact by improving policy over time. Monitoring, evaluation, and experimentation help governments detect failure, end ineffective programs, and scale what works. Mexico’s PROGRESA illustrates the point. Rigorous evaluation supported evidence-based scaling and political sustainability. The contrast is costly. Prolonged protection of underperforming industries shows what happens when learning is missing. Treating learning as integral helps institutionalize change. Performance improves through feedback rather than waiting for a crisis.

    Making change stick

    LAC’s productivity gaps persist for many reasons, but a common pattern emerges in practice: reforms often move in pieces, and those pieces do not reinforce one another. The result is predictable. Progress stalls, credibility erodes, and governments end up reiterating the same agenda under tighter constraints.

    One practical application is to design a policy-based MDB loan around the five functions, with actions sequenced to build credibility and manage resistance. A first step could set the direction (a published, costed transformation strategy with a delivery mandate) and establish clear rules (time-bound regulatory changes that reduce discretion and clarify incentives). A second tranche could tie disbursement to early delivery (a small number of visible, implementable investments or services) and to coordination (a standing cross-ministry delivery unit with agreed financing, risk governance, and stakeholder engagement). A final tranche could institutionalize learning (monitoring and evaluation, feedback loops, and pre-agreed “course-correction” triggers if targets are missed). Across different groups, indicators would track not only outputs, but credibility signals—policy stability, dispute-resolution performance, procurement integrity, and whether feedback is acted on—so the loan supports lasting change rather than one-off compliance.

    What success looks like is alignment that compounds over time: direction that stays credible, rules that enable action, delivery that builds confidence, coordination that sustains coalitions, and learning that keeps the system adaptive. Uruguay’s renewables build-out shows what this alignment can look like in practice. The payoff is cumulative capability and resilience, not episodic reform cycles.

    Policymakers can use this functional lens to break transformation into manageable blocks and to communicate a credible pathway, internally and with partners. The key is to plan reforms as a reinforcing portfolio, not as disconnected initiatives. That requires managing uncertainty and resistance throughout implementation—distributional conflict, bureaucratic inertia, veto points, and interests seeking delay or exemptions. In practice, governments should ask two discipline questions at each stage: what function is missing, and what would make the next step politically and operationally credible? For MDB-supported programs, this lens also helps shift policy loans from checklist compliance to sequenced capability-building, with disbursements and indicators that reward delivery, coordination, and learning—not just legal changes on paper. Used this way, the model supports coherent, durable transformation.

  • Venezuela’s Oil Boom 1920–1970: Institutional Lessons

    Venezuela’s Oil Boom 1920–1970: Institutional Lessons

    Venezuela’s oil boom between 1920 and 1970 represents one of the most compressed episodes of economic transformation in Latin American history, driven overwhelmingly by petroleum extraction. Real GDP per capita rose from roughly 20% of U.S. levels in 1920 to about 90% by 1958, growth unmatched elsewhere in the region during the period. This was powered almost entirely by foreign direct investment in oil, with crude production rising from about 1 million barrels annually in the early 1920s to 137 million barrels by 1929, making Venezuela one of the world’s largest oil producers and exporters. Oil’s share of exports jumped from 1.9% in 1920 to 91.2% by 1935, while agriculture’s share of GDP fell from over 30% toward single digits by mid‑century. The same mechanisms that generated rapid income growth, therefore, restructured the entire economy around a single enclave sector.

    The core policy challenge was that oil‑driven growth reconfigured Venezuela into a rent‑dependent state before institutions capable of managing diversification were built. Massive inflows of foreign capital appreciated the Bolívar, eroding competitiveness in agriculture and manufacturing, a phenomenon later known as Dutch Disease. By the 1950s, oil revenues had almost entirely replaced personal income taxation, transforming the state from a tax‑collecting institution into a rent-distributor. This fiscal architecture weakened incentives to build productivity in non‑oil sectors and severed the accountability link between citizens and the state. Inequality remained extreme despite high average incomes: in 1970, the poorest quintile received only 3% of national income, while the richest quintile received 54%.

    The implied policy objective was to convert temporary oil windfalls into a diversified, productivity‑based economy supported by durable fiscal and learning institutions. Venezuela’s own reform debates articulated this goal explicitly, most notably in the 1936 call to “sembrar el petroleo” by reinvesting rents into productive capacity beyond petroleum. Achieving this outcome required sequencing: first capturing rents, then building tax institutions, learning systems, and diversification mechanisms before rent distribution became politically locked in. The historical record shows that this transition was only partially attempted and never completed. The call to action is therefore to extract institutional lessons from this failure rather than replicate its revenue successes alone.

    Oil reshaped the whole economy around one sector

    Oil discovery irreversibly reallocated Venezuela’s dominant capital stock from cultivated land to subsoil hydrocarbons, concentrating both energy and financial flows in petroleum extraction. Between 1920 and 1935, oil’s share of exports rose from 1.9% to 91.2%, while agriculture’s contribution to GDP declined from over 30% in 1920 toward roughly 5–6% by the 1970s. Annual crude production expanded from about 1 million barrels in the early 1920s to 137 million barrels by 1929, supported by more than 100 foreign companies operating in the country by the late 1920s. These inflows generated rapid income growth but also appreciated the Bolívar, systematically undermining price competitiveness in other tradable sectors. The result was an economy whose growth depended on a single, externally operated capital stock.

    The oil boom triggered a rapid reconfiguration of social institutions as labor and population followed oil‑linked income opportunities. Venezuela’s urban population rose from an estimated 20% in 1920 to 39.2% by the 1941 census, and then accelerated further to nearly 80% by 1980. Oil revenues raised wages in the petroleum sector and the state, pulling labor out of agriculture as coffee income fell to less than one‑tenth of GDP by the 1950s. Population growth accelerated from about 2.8% per year in 1920–1940 to 3–4% thereafter, driven by falling mortality and immigration attracted by oil prosperity. The state attempted to meet surging demand for housing, health, and education primarily through oil rents rather than through broad‑based taxation.

    A new social order emerged in which political stability depended on the distribution of oil rents rather than on taxing citizens. By the 1950s, oil revenues had largely replaced personal income taxes, creating a rentier bargain between the state and society. The 1958 Punto Fijo pact institutionalized this logic by allocating state employment and oil revenues among major political parties in proportion to electoral results. While this arrangement sustained democratic stability, it concentrated wealth and entrenched inequality, with the bottom quintile receiving only 3% of income in 1970. Social services expanded, but the underlying income distribution and productive structure remained unchanged.

    Rent capture over diversification

    Early oil development generated significant institutional and technological variation, particularly under the Gómez concession regime between 1908 and 1935. More than 100 foreign firms introduced different extraction technologies, management practices, and labor models, creating a diverse organizational ecology in the oil sector. At the same time, competing development ideas emerged domestically, including the 1936 proposal to reinvest oil rents into a diversified economy. Political movements also differed in their visions, ranging from low‑royalty concession models to more assertive resource nationalism. This variation created genuine choice over Venezuela’s development trajectory.

    From this range of options, the state selected institutional arrangements that maximize revenue while preserving foreign operational control. The 1943 Hydrocarbons Law standardized concessions, set a 16.67% royalty, and codified the 50/50 profit‑sharing principle, which was strengthened in 1948. Within five years of the 1943 law, government oil income was widely reported to have increased roughly sixfold, a powerful selection signal that favored rent capture over riskier diversification strategies. At the macro level, attempts at import‑substitution industrialization were repeatedly undercut by an appreciated currency and a political preference for distributing rents. The 1958 Punto Fijo pact represented a second‑order selection, choosing a democratic patronage system over both dictatorship and radical redistribution.

    Venezuela’s chosen institutions diffused unevenly, with global influence but domestic lock‑in. Internationally, the 50/50 profit‑sharing model spread rapidly and became a global norm, and Venezuela co‑founded OPEC in 1960 to extend state sovereignty over oil pricing. Domestically, however, rentier institutions were retained and deepened: personal income taxation remained marginal, and non‑oil sectors relied on oil‑funded subsidies. Even as labor productivity in the oil sector rose by 125% between 1960 and 1970, these gains did not diffuse into broader industrial ecosystems. The economy became path‑dependent on the distribution of rents rather than on productivity growth.

    Revenue capacity outpaced learning capacity

    The Venezuelan state’s most effective interventions involved rule‑setting that increased its share of oil rents without disrupting production. The 1943 Hydrocarbons Law and its 1948 amendments created predictable fiscal rules that balanced state revenue with continued foreign investment. In 1960, the creation of the Corporación Venezolana de Petróleo inserted the state into commercial operations, and Venezuela’s role in founding OPEC demonstrated its capacity to shape global market architecture. These actions show strong regulatory and negotiating capability. However, they focused on revenue extraction rather than on steering the structure of domestic markets.

    Oil revenues financed unprecedented levels of public investment in infrastructure and social services. Between 1920 and 1958, oil rents funded road networks, urban expansion in Caracas, and improvements in health and education that reduced mortality from about 12.3 per 1,000 in 1950–55 toward 5.5 per 1,000 by 1980. In the 1960s, the state launched the Ciudad Guayana industrial complex, combining steel, aluminum, and hydroelectric power as a planned growth pole. Public investment reached 24% of total investment by 1970, rising further thereafter. Yet increasing state dominance also crowded out private capital and raised risks of misallocation.

    State capacity to absorb and diffuse knowledge lagged its fiscal power. The Corporación Venezolana de Fomento, created in 1946 to promote non‑oil industries, struggled because an appreciated currency and cheap imports undermined competitiveness. Despite a 125% rise in oil‑sector labor productivity between 1960 and 1970, the state failed to build institutions that transferred skills, technology, or management practices into downstream or unrelated sectors. Fiscal surpluses in the 1960s, averaging 0.9% of GDP, provided an opportunity to capitalize on a stabilization or sovereign wealth fund, but no such institution was created. This missed sequencing step left the economy exposed to future shocks.

    Key lessons for policymakers

    Venezuela’s oil boom demonstrates that rapid income growth without institutional sequencing can entrench structural vulnerability. The country solved the problem of rent capture, but not the harder problem of converting rents into diversified productive capacity. By substituting oil revenues for taxation, the state weakened accountability and tied political stability to commodity cycles. High growth, therefore, coexisted with persistent inequality and fragile institutions.

    Success would have required a state that used oil rents to build tax institutions, learning systems, and counter‑cyclical buffers before distributing rents broadly. In such a scenario, oil would have financed diversification rather than replaced it, and productivity gains in the enclave sector would have diffused into the wider economy. Fiscal stability would not have depended on continuous oil price growth, and political coalitions would have been anchored in productive capacity rather than rent allocation.

    For today’s LAC policymakers, the lesson is to prioritize institutional sequencing over revenue maximization. Capture rents early while simultaneously building tax capacity, learning institutions, and stabilization mechanisms before rent distribution becomes politically entrenched. Invest explicitly in knowledge transfer and absorptive capacity, not just infrastructure. Avoid designing political settlements that depend on permanent commodity windfalls. The cost of delaying these steps is not slower growth, but the long‑term fragility that Venezuela’s experience makes clear.

  • How Chile Built Copper and Salmon Exports 1980–2010

    How Chile Built Copper and Salmon Exports 1980–2010

    Between 1980 and 2010, Chile moved from a volatile, copper-dependent economy toward a more complex export platform—still anchored in copper but complemented by a globally significant salmon aquaculture industry. The core policy challenge was not simply “grow exports,” but to convert a highly volatile copper rent stream into stable fiscal capacity, while building new tradable sectors capable of competing in demanding markets. Chile’s experience is relevant across Latin America and the Caribbean because it highlights two design problems that recur in resource-rich settings: how to build credible macro-fiscal buffers before the boom peaks, and how to create a sector where private investors will not initially bear technology and market-entry risk.

    This post unpacks the transformation through three lenses: (1) how Chile’s “human ecosystem” changed in terms of capital stocks/flows, institutions, and social cycles, (2) what drove changes via variation–selection–diffusion mechanisms, and (3) what the state did—especially in fiscal rulemaking, market architecture, and innovation catalysis. A practical objective is to make the mechanisms visible (rules, sequencing, incentives, and state capabilities), including where the economic model that was used imposed costs, most clearly in the salmon sector’s regulatory lag and disease crisis. 

    Human ecosystem shifts: capital, institutions, and cycles

    The most visible shift in capital stocks and flows was scale. Copper production expanded from roughly 1 million metric tons (1980) to over 5.4 million (2010), reinforcing Chile’s role as a global copper leader. In parallel, salmon exports moved from near-zero in the early 1980s to a major non-traditional export. By 2007, exports reached about US$2.3 billion, and Chile became the world’s second-largest salmon producer. Macro-financial flows were also re-engineered: a stabilization fund architecture evolved from the mid-1980s copper fund into the Economic and Social Stabilization Fund (ESSF) created in 2007, enabling a countercyclical response during the global financial crisis, including a reported stimulus package of up to US$9 billion, including about US$4 billion of direct finance.

    Two institution-building pathways mattered during this time. First, in copper, Chile preserved a capable state producer (Corporación Nacional del Cobre de Chile (CODELCO)) while designing a legal and fiscal environment that could support large private investments over long horizons. Second, in salmon, the institutional breakthrough was a hybrid innovation vehicle: Fundación Chile helped transfer and adapt cage-farming technologies, absorbing early-stage uncertainty and demonstrating commercial viability before wider private entry. Over time, a supporting industrial ecosystem formed: by 2010, the salmon cluster included over 4,000 small and medium-sized enterprises (SMEs) in logistics and specialized inputs (e.g., vaccines). Social outcomes shifted as well: poverty rates fell from about 45% (1987) to 11.5% (2009), thereby expanding domestic socioeconomic resilience even as growth remained export-led.

    Chile’s political economy consolidated a “dual track”: copper rents were partly captured directly through CODELCO (accounting for a major share of total fiscal revenue), while private capital expanded production under secure rules. The fiscal system was redesigned to weaken boom–bust cycles through the Structural Fiscal Surplus Rule (2001) and the ESSF (2007), effectively decoupling domestic spending from copper price volatility. The salmon sector, however, illustrates the consequences of institutional lag in fast-growing resource-based activities: the infectious salmon anemia (ISA) virus crisis (2007–2010) caused a major rupture that forced post hoc upgrading of sanitary and environmental governance. The combined message is that Chile strengthened macroeconomic “shock absorbers” in copper earlier and more systematically than it built ecosystem and biosecurity shock absorbers in salmon.

    What drove the changes: variation, selection, and diffusion

    The 1980s are characterized as a period of experimentation. In mining, institutional variation took the form of a high-security concession model created by early-1980s changes in mining laws and the code, which introduced “constitutional concessions” that co-existed with state ownership. In aquaculture, variation combined natural endowments (southern cold waters) with imported production knowledge; Fundación Chile’s early pilots served as structured experiments that reduced uncertainty about whether salmon farming could be commercially viable at scale in Chile.

    Chile’s selection environment was not purely “market.” For copper, the Foreign Investment Statute (DL 600) is described as providing guarantees that improve predictability for investors, favoring large-scale, capital-intensive projects able to ride long commodity cycles (the Escondida mine is an emblematic case). For salmon, selection occurred through a state-supported proof-of-concept logic: public or hybrid pilots helped demonstrate profitability, after which private firms and a supplier base expanded rapidly. The same selection forces also revealed weaknesses: disease dynamics (ISA) and subsequent regulatory tightening acted as a harsh selection event, penalizing high-density growth models that had outpaced monitoring and enforcement capacity.

    In macroeconomic management, diffusion and retention were institutional: the copper fund architecture evolved into the ESSF, and the structural fiscal rule became a routine for transforming volatile rents into predictable fiscal space. In productive sectors, diffusion took the form of clustering and supply-chain deepening—especially in salmon, where know-how and specialized services spread through a dense regional ecosystem (including thousands of SMEs). A policy-relevant tension is apparent: Chile retained “good” fiscal governance routines relatively early. “Bad” routines in salmon production were maintained for perhaps too long, e.g., high-density expansion with insufficient biosecurity, increasing the probability and cost of a later crisis.

    State role: rules, finance, and learning

    The state’s central contribution was market architecture. In copper, Chile maintained a state anchor (CODELCO) while creating credible, high-security investment rules for private entry via concessions and the DL 600 framework. In macro policy, the state adopted a Structural Fiscal Surplus Rule (2001) to manage “Dutch disease” risks by saving during booms. This rules-based approach mattered because it made intertemporal trade-offs explicit and constrained short-term political spending pressures. The result was institutional continuity that survived major political transitions and supported long-duration investments typical of mining.

    Chile used copper-linked institutions to convert volatile revenues into countercyclical fiscal capacity. The sequence from earlier copper stabilization mechanisms to the ESSF (2007), which supported crisis-era spending, included the reported US$9 billion stimulus during the 2008–2009 shock. In parallel, the state supported the productive base by enabling investments in ports, energy, and related infrastructure, helping both private mining and aquaculture scale in geographically remote regions. The policy lesson is not “spend more,” but “spend with buffers”: stabilization funds and fiscal rules created room to maintain public investment when external conditions deteriorated.

    The salmon case underscores a specific state capability: acting as an early “venturer” when private investors will not fund uncertain learning. Through Fundación Chile (a public–private initiative between the Chilean state and International Telephone & Telegraph (ITT)), the state absorbed initial technical and market risks, proved a business model, and then exited by selling pilot companies to the private sector. This is a replicable design choice for LAC countries seeking new tradables: create an institution with technical autonomy and an explicit exit mechanism. The caution is equally important: innovation policy cannot stop at production know-how. The ISA crisis illustrates that regulatory science (biosecurity, environmental monitoring, and enforcement routines) must co-evolve with industrial scaling, or the state will have to rebuild the sector under crisis conditions.

    Policy takeaways for Latin America and the Caribbean

    Chile’s experience suggests that “resource-led” growth is not pre-determined by geology; it is shaped by institutional choices about rent management, market rules, and the state’s capacity to learn. 

    Three policy takeaways stand out:

    1. Build fiscal buffers as core infrastructure, not as a “nice to have.” Chile’s stabilization architecture (structural rule plus the ESSF) is a precondition for countercyclical policy in a commodity economy, not an optional add-on.

    2. Use hybrid institutions to create sectors—but design the exit and the governance. Fundación Chile’s model shows how a public–private vehicle can reduce technology and market-entry uncertainty and crowd in private investment; the institutional design (autonomy, technical capability, and an exit path) is the transferable element.

    3. Do not let production scale outrun regulatory science. Salmon’s rapid expansion delivered exports and clusters, but the ISA shock illustrates the costs of regulatory lag. Governance for biosecurity and environmental risk must be built early, alongside incentives for growth.

    For Latin America and the Caribbean policymakers, the practical implication is to treat sector strategy as a portfolio problem: protect the budget from commodity volatility, use targeted, capability-based institutions to build new tradables, and ensure that regulatory and monitoring capacity grows at the same pace as production. The opportunity is immediate for countries facing new mineral or aquaculture booms: build the fiscal and regulatory “shock absorbers” before scale makes reform politically and technically harder. 

  • Trinidad & Tobago’s LNG Boom: 1998–2008

    Trinidad & Tobago’s LNG Boom: 1998–2008

    Trinidad & Tobago transformed its development trajectory between 1998 and 2008 by converting an underused natural gas reserve into a globally competitive liquefied natural gas export platform. Over this decade, real per capita income rose sharply, and foreign investment reached historic levels as the Atlantic LNG complex expanded from a concept into four operating trains. This emergence as a major LNG exporter unlocked financing flows, attracted multinational partners, and reshaped national energy markets. At the same time, it introduced significant risks, including dependence on a narrow industrial base, exposure to global energy cycles, and limited diffusion of benefits into the broader economy. 

    This blog explains how the country’s human ecosystem changed during the boom, the evolutionary economic forces that drove the rapid transformation, and the state’s role in shaping institutions, rules, and investment sequencing. The purpose is to translate the Trinidad & Tobago experience into actionable insights for policymakers across Latin America and the Caribbean as they navigate their own transitions. 

    Economic and social transformation

    The human ecosystem changed fundamentally as natural capital was rapidly converted into financial and industrial capital. Offshore gas reserves that were largely stranded in the early 1990s led to the commissioning of four LNG production lines, or trains, between 1999 and 2005, with a cumulative investment of approximately US$3.6 billion. Gas utilization surged from ~550 million standard cubic feet per day in 1991 to ~3,760 million standard cubic feet per day by 2006, while methanol capacity expanded from 480,000 tons to 6.62 million tons and ammonia capacity from 2.17 million tons to over 5 million tons. These shifts generated major capital flows, with foreign direct investment stock reaching US$12.44 billion by 2007, and GDP per capita roughly quadrupled between the mid-1990s and mid-2000s. Social institutions evolved in parallel through the strengthening of the National Gas Company as the central aggregator and the consolidation of industrial estates at Point Lisas and Point Fortin. These governance structures created a specialized export-oriented social order focused almost exclusively on gas monetization. The social cycle also shifted into a pro-cyclical pattern, as surging LNG revenues after 1999 fueled rapid fiscal expansion and heightened vulnerability to price swings. By the mid-2000s, signals of rising reserve pressure and emerging competitors appeared, but the prevailing assumption remained continued expansion, based on discussions of additional trains and new downstream projects.

    Why LNG took off

    The country’s LNG expansion can be understood through the evolutionary dynamics of variation, selection, and diffusion. Variation emerged through multiple competing configurations for gas use, including LNG export, petrochemicals, power generation, and regional pipeline options. Within LNG itself, commercial structures varied across equity participation, tolling arrangements, and train scales, while successive trains adopted the Phillips Optimized Cascade process, enabling incremental technological learning and larger plant capacities. Selection pressures came from global demand signals in the United States and Europe, which favored Trinidad & Tobago’s reliable, cost-competitive gas supply underpinned by stable institutions. Domestic liberalization in the early 1990s and a clear gas-focused industrial policy further reinforced LNG as the dominant monetization pathway. As Train 1 succeeded, the rapid approval of Trains 2, 3, and 4 in 2000–2005 demonstrated institutional preference for scaling a proven model. Diffusion occurred through the construction of pipelines linking offshore fields to industrial nodes, long-term contracts with US and Spanish buyers in the first train, and the creation of revenue-management institutions such as the Heritage and Stabilisation Fund—these mechanisms locked in the LNG-petrochemical ecosystem, creating a durable path dependence in the industry. However, diffusion into non-energy sectors remained limited, and non-energy exports did not form a significant new cluster despite overall GDP growth.

    How the state shaped the gas economy

    The state acted as the strategic architect and market constructor by lifting the long-standing ban on gas exports, thereby enabling LNG development for the first time. It designated the National Gas Company as a quasi-monopsony buyer responsible for aggregating gas and selling it to downstream firms at administered prices, thereby helping establish competitive petrochemical production. It also developed a production‑sharing contract framework that defined how output and risks would be shared between investors and the state; this system was later recalibrated during the 2006 Petroleum Fiscal Review to improve rent capture. In parallel, the state undertook major public investments, including the 36-inch East Coast pipeline, the 56-inch Cross Island Pipeline, and industrial estate infrastructure under PLIPDECO. It also signaled willingness to absorb risk by taking equity in Train 1, which reassured private partners during the early phase. The state created revenue stabilization instruments such as the Interim Revenue Stabilisation Fund in 2000 and its successor, the Heritage and Stabilisation Fund in 2007, to buffer volatility. Despite these achievements, the state fell short in cultivating an indigenous innovation ecosystem. The industrialization-by-invitation model relied heavily on multinational expertise, limiting the development of deep domestic capabilities and contributing to the enclave character of the energy sector, which generated 80 percent of exports but only around 5 percent of jobs.

    Policy lessons from the LNG boom

    Three policy lessons stand out for resource-rich economies in Latin America and the Caribbean. First, credible rules matter more than state ownership: lifting restrictive bans, designing transparent contract frameworks, and ensuring predictable pricing can catalyze investment more effectively than insisting on large state equity shares. Second, infrastructure and institutional assets are the most durable legacies of a resource boom; pipeline networks, industrial estates, and competent energy agencies convert temporary natural capital into long-term socioeconomic value. Third, stabilization and diversification must begin early, before peak production. Stabilization funds need strict rules, and local content and skill-building mechanisms must be embedded from the outset to avoid the enclave dynamics observed in Trinidad & Tobago. The broader message is that successful industrialization requires not just capital and technology but deliberate institutional design to ensure that natural resource wealth produces sustainable, inclusive development. Policymakers today should apply these lessons to emerging opportunities in critical minerals and hydrocarbons, anticipating future vulnerabilities rather than responding to them after the fact.